

What is it?
TOD Blueprint in Boston is a data analysis and visualization project aimed at identifying the best locations for Transit-Oriented Development (TOD) in the Greater Boston area. It uses a two-step model:
1
Evaluate and rank communities based on TOD suitability using five spatial and economic indicators.
2
Within the top community, evaluate individual transit stations based on ridership flow and usage patterns.
The outcome is a focused, cost-aware TOD recommendation centered on Quincy Center Station.
Why does it matter?
In response to the MBTA Communities Zoning Requirement and growing urban sustainability needs, this project supports smart, walkable, and accessible development around public transit. TOD is about density and about placing people where transit already works. By combining population activity, developable land, and economic feasibility, this project offers a data-grounded lens for local governments and planners to prioritize impactful and affordable transit-based growth.
HOW DID I COME IN?
Step 1: Community-Level Evaluation
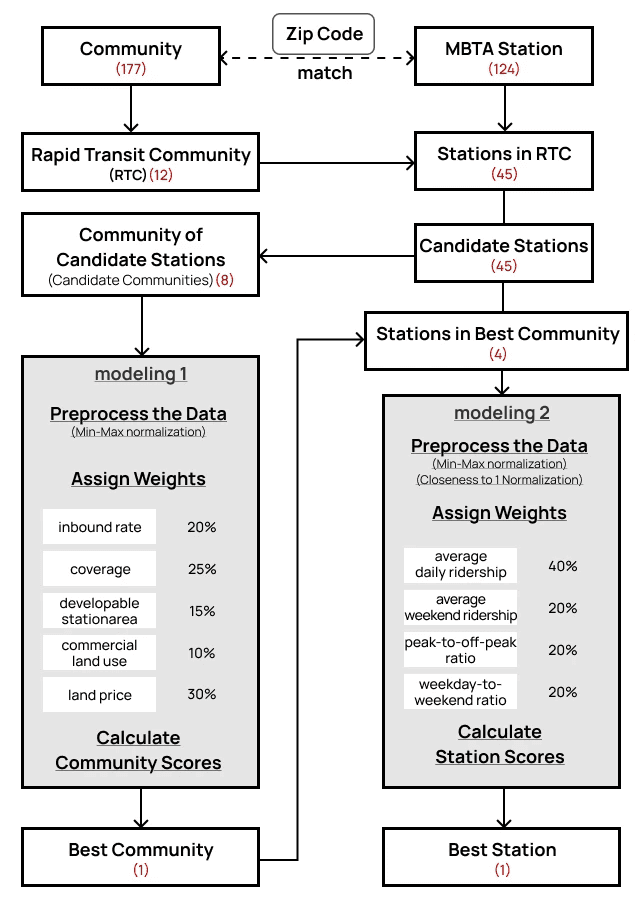
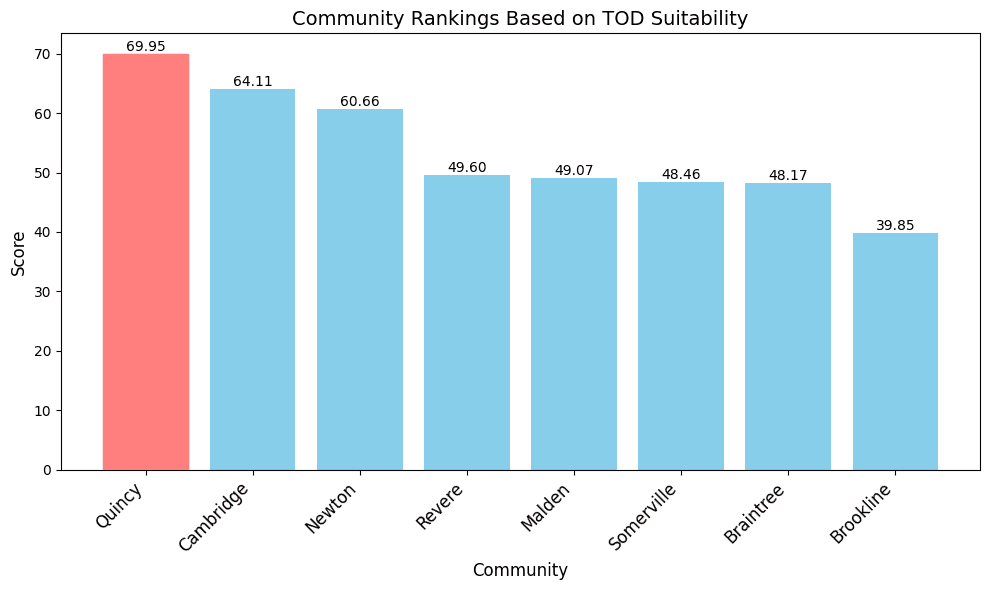
From 177 MBTA communities, 8 rapid transit candidates were selected and ranked using a weighted score model:
Inbound Rate (20%): Transit activity per resident
Coverage (25%): % of community area within walking distance to a station
Developable Station Area (15%): Size of usable land near stations
Commercial Land Use (10%): TOD-relevant zoning potential
Land Price (30%): Cost-effectiveness of development
Result
Quincy ranked #1, offering high accessibility, ample developable space, and affordable land values.
Step 2: Station-Level Evaluation (within Quincy)
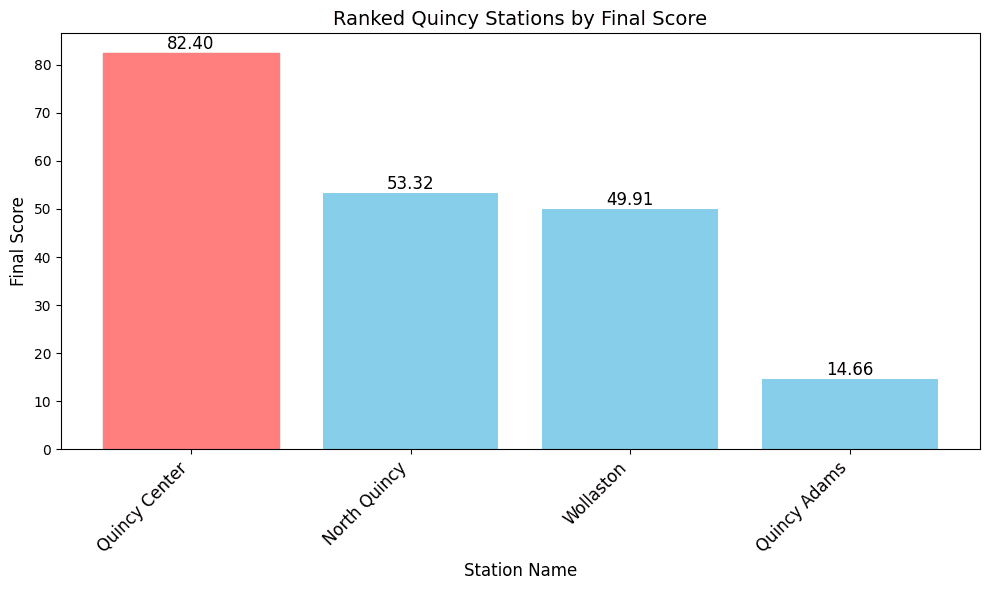
Four stations in Quincy were ranked using ridership data (Fall 2023):
Average daily ridership (40%)
Weekend ridership (20%)
Stability 1: Peak vs off-peak (20%)
Stability 2: Weekday vs weekend (20%)
Result
Quincy Center Station scored 82.40, significantly higher than other Quincy stations, making it the top TOD candidate.
What did the data reveal?
1
Communities like Revere and Malden show high transit use but have limited developable land.
2
Communities like Brookline and Cambridge have excellent accessibility but high land costs and limited commercial gaps.
3
Quincy offered a rare balance: solid ridership, walkable coverage, available land, and low land prices.
What would a TOD project at Quincy Center look like?
Using benchmarks from the Prudential Center and local developments:
1
Development Size
500,000 sq ft (mixed-use: residential, office, retail)
2
Land Area
3.8 acres
3
Estimated Total Cost
~$481.6 million
Construction: $350M
Land: ~$2.1M
Soft Costs: $129.5M
4
Functional Breakdown
100,000 sq ft for retail, 400,000 sq ft for housing and employment
This design strengthens Quincy Center’s role as a regional activity node while maintaining economic feasibility.
What did I learn?
Using benchmarks from the Prudential Center and local developments:
Clear structure makes complex systems legible
From zip-code matching to station-area filtering, organizing geospatial data carefully was key.
2
Quantifying intuition builds trust
Using weighted scoring made decision-making transparent, especially in multi-variable environments.
3
Balance matters more than extremes
High ridership alone didn’t guarantee suitability. The best location was one that blended transit use, land value, and real estate opportunity in a TOD project.
4
More stakeholders need to be involved
I assigned the weights in my model by myself based on logic and research. Still, they were not reviewed or confirmed by others. Input from stakeholders or reference to policy benchmarks could help adjust these choices.
This design strengthens Quincy Center’s role as a regional activity node while maintaining economic feasibility.
want to Explore the full project?