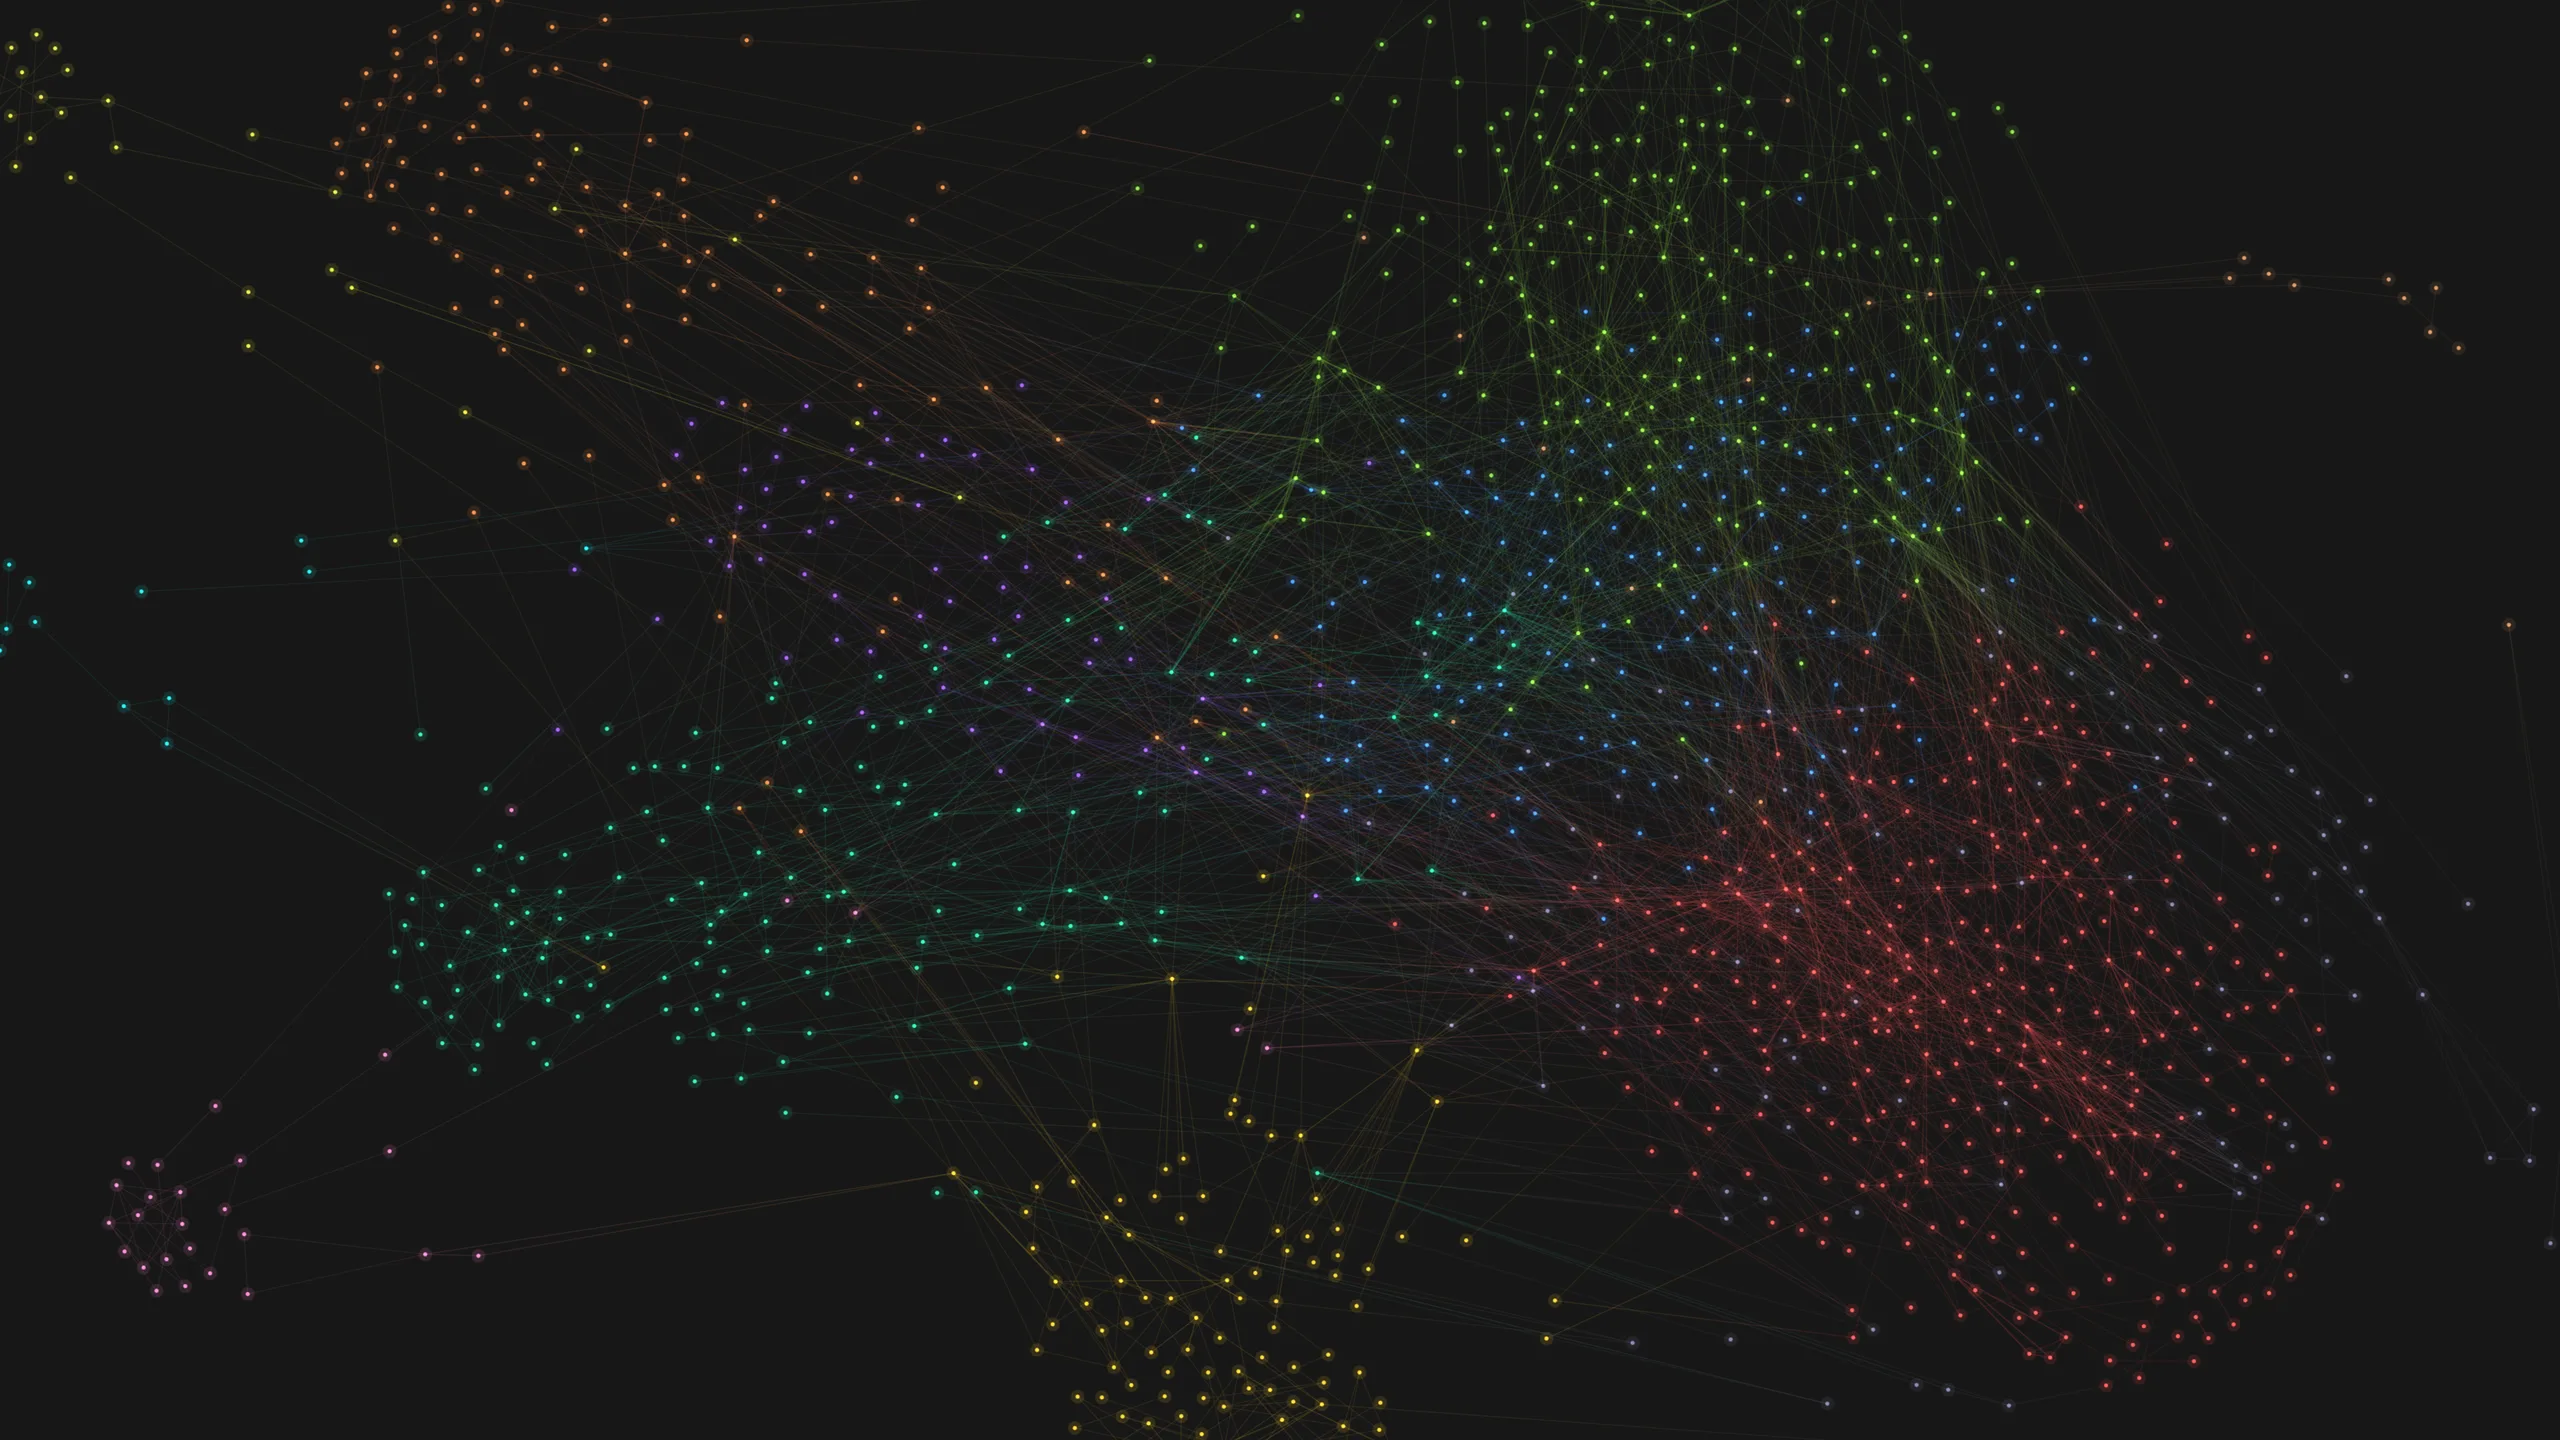
An interactive research tool for exploring coauthorship across scholars, departments, and research centers at Northeastern University.
- D3.js
- HTML Canvas
- Python
Hi, I’mZhuoqi.pronounced “draw-chee”
From research networks to human movement, I build interactive tools to explore patterns too large to see all at once.
An interactive research tool for exploring coauthorship across scholars, departments, and research centers at Northeastern University.
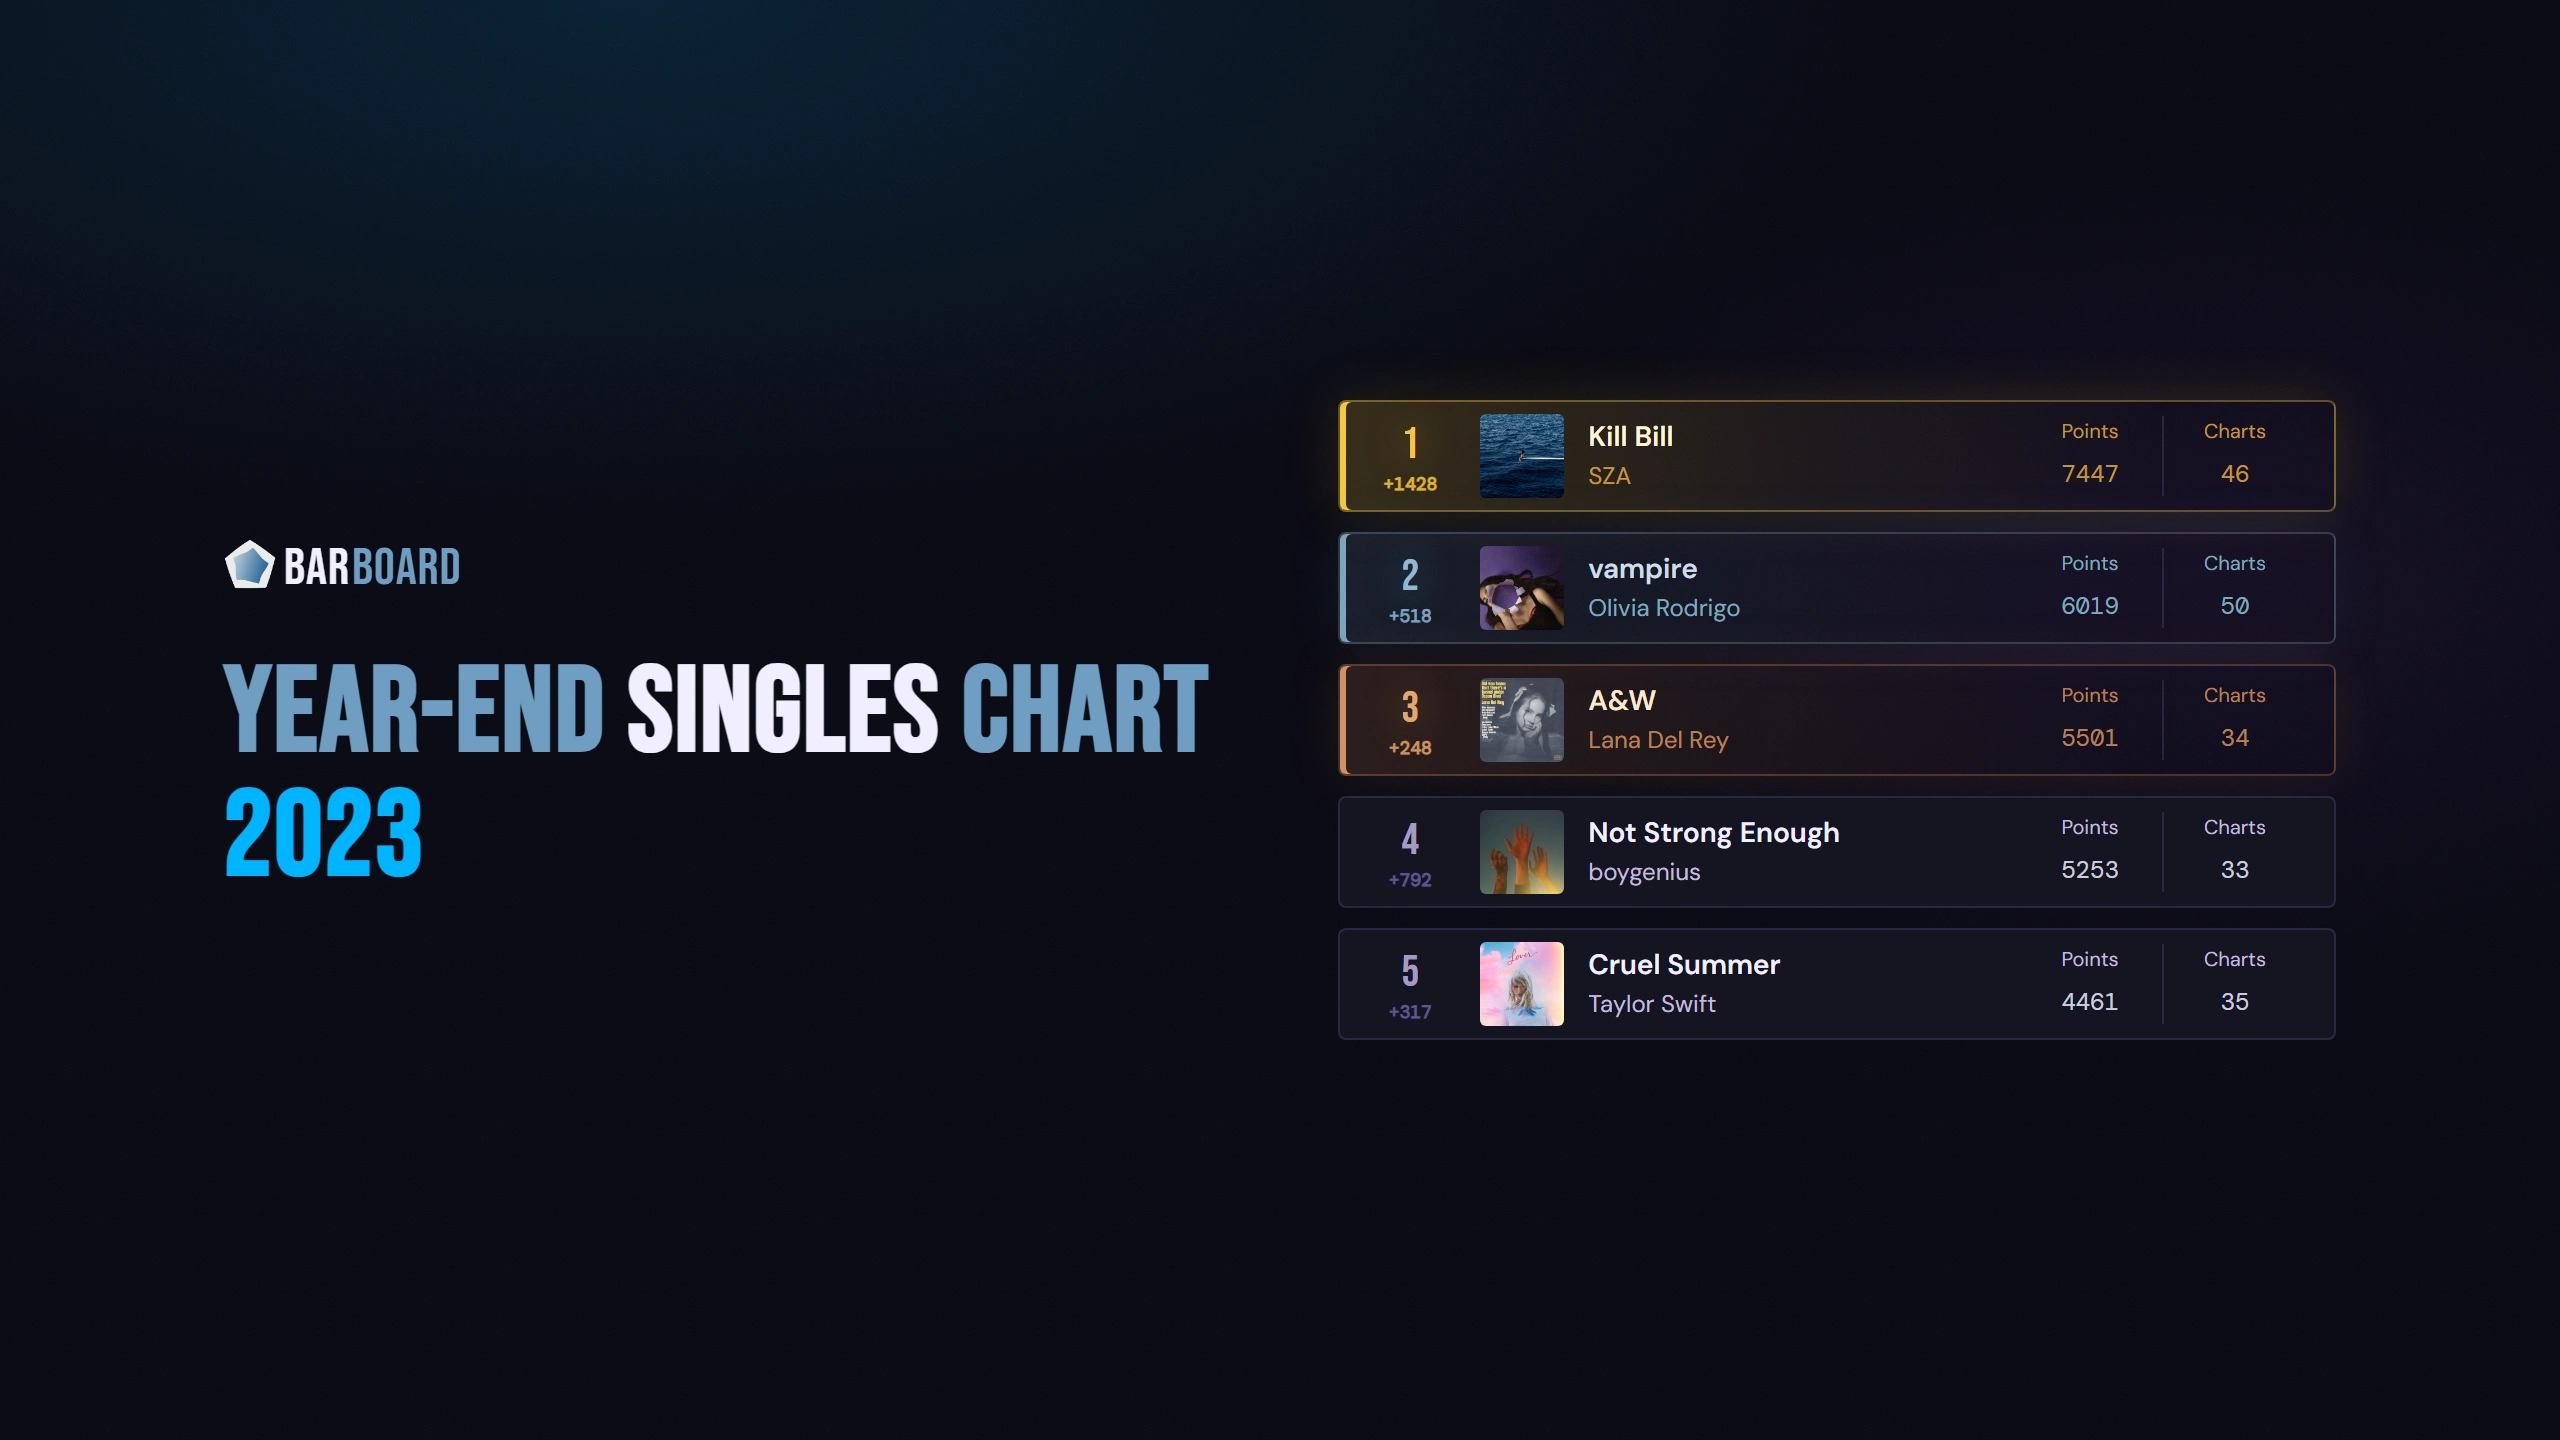
A community music website for exploring shared charts, following song contests, and revisiting members’ records.
I organized, designed, hosted, and operated a community song contest, creating its visual identity and a browser-based system for the live grand final.

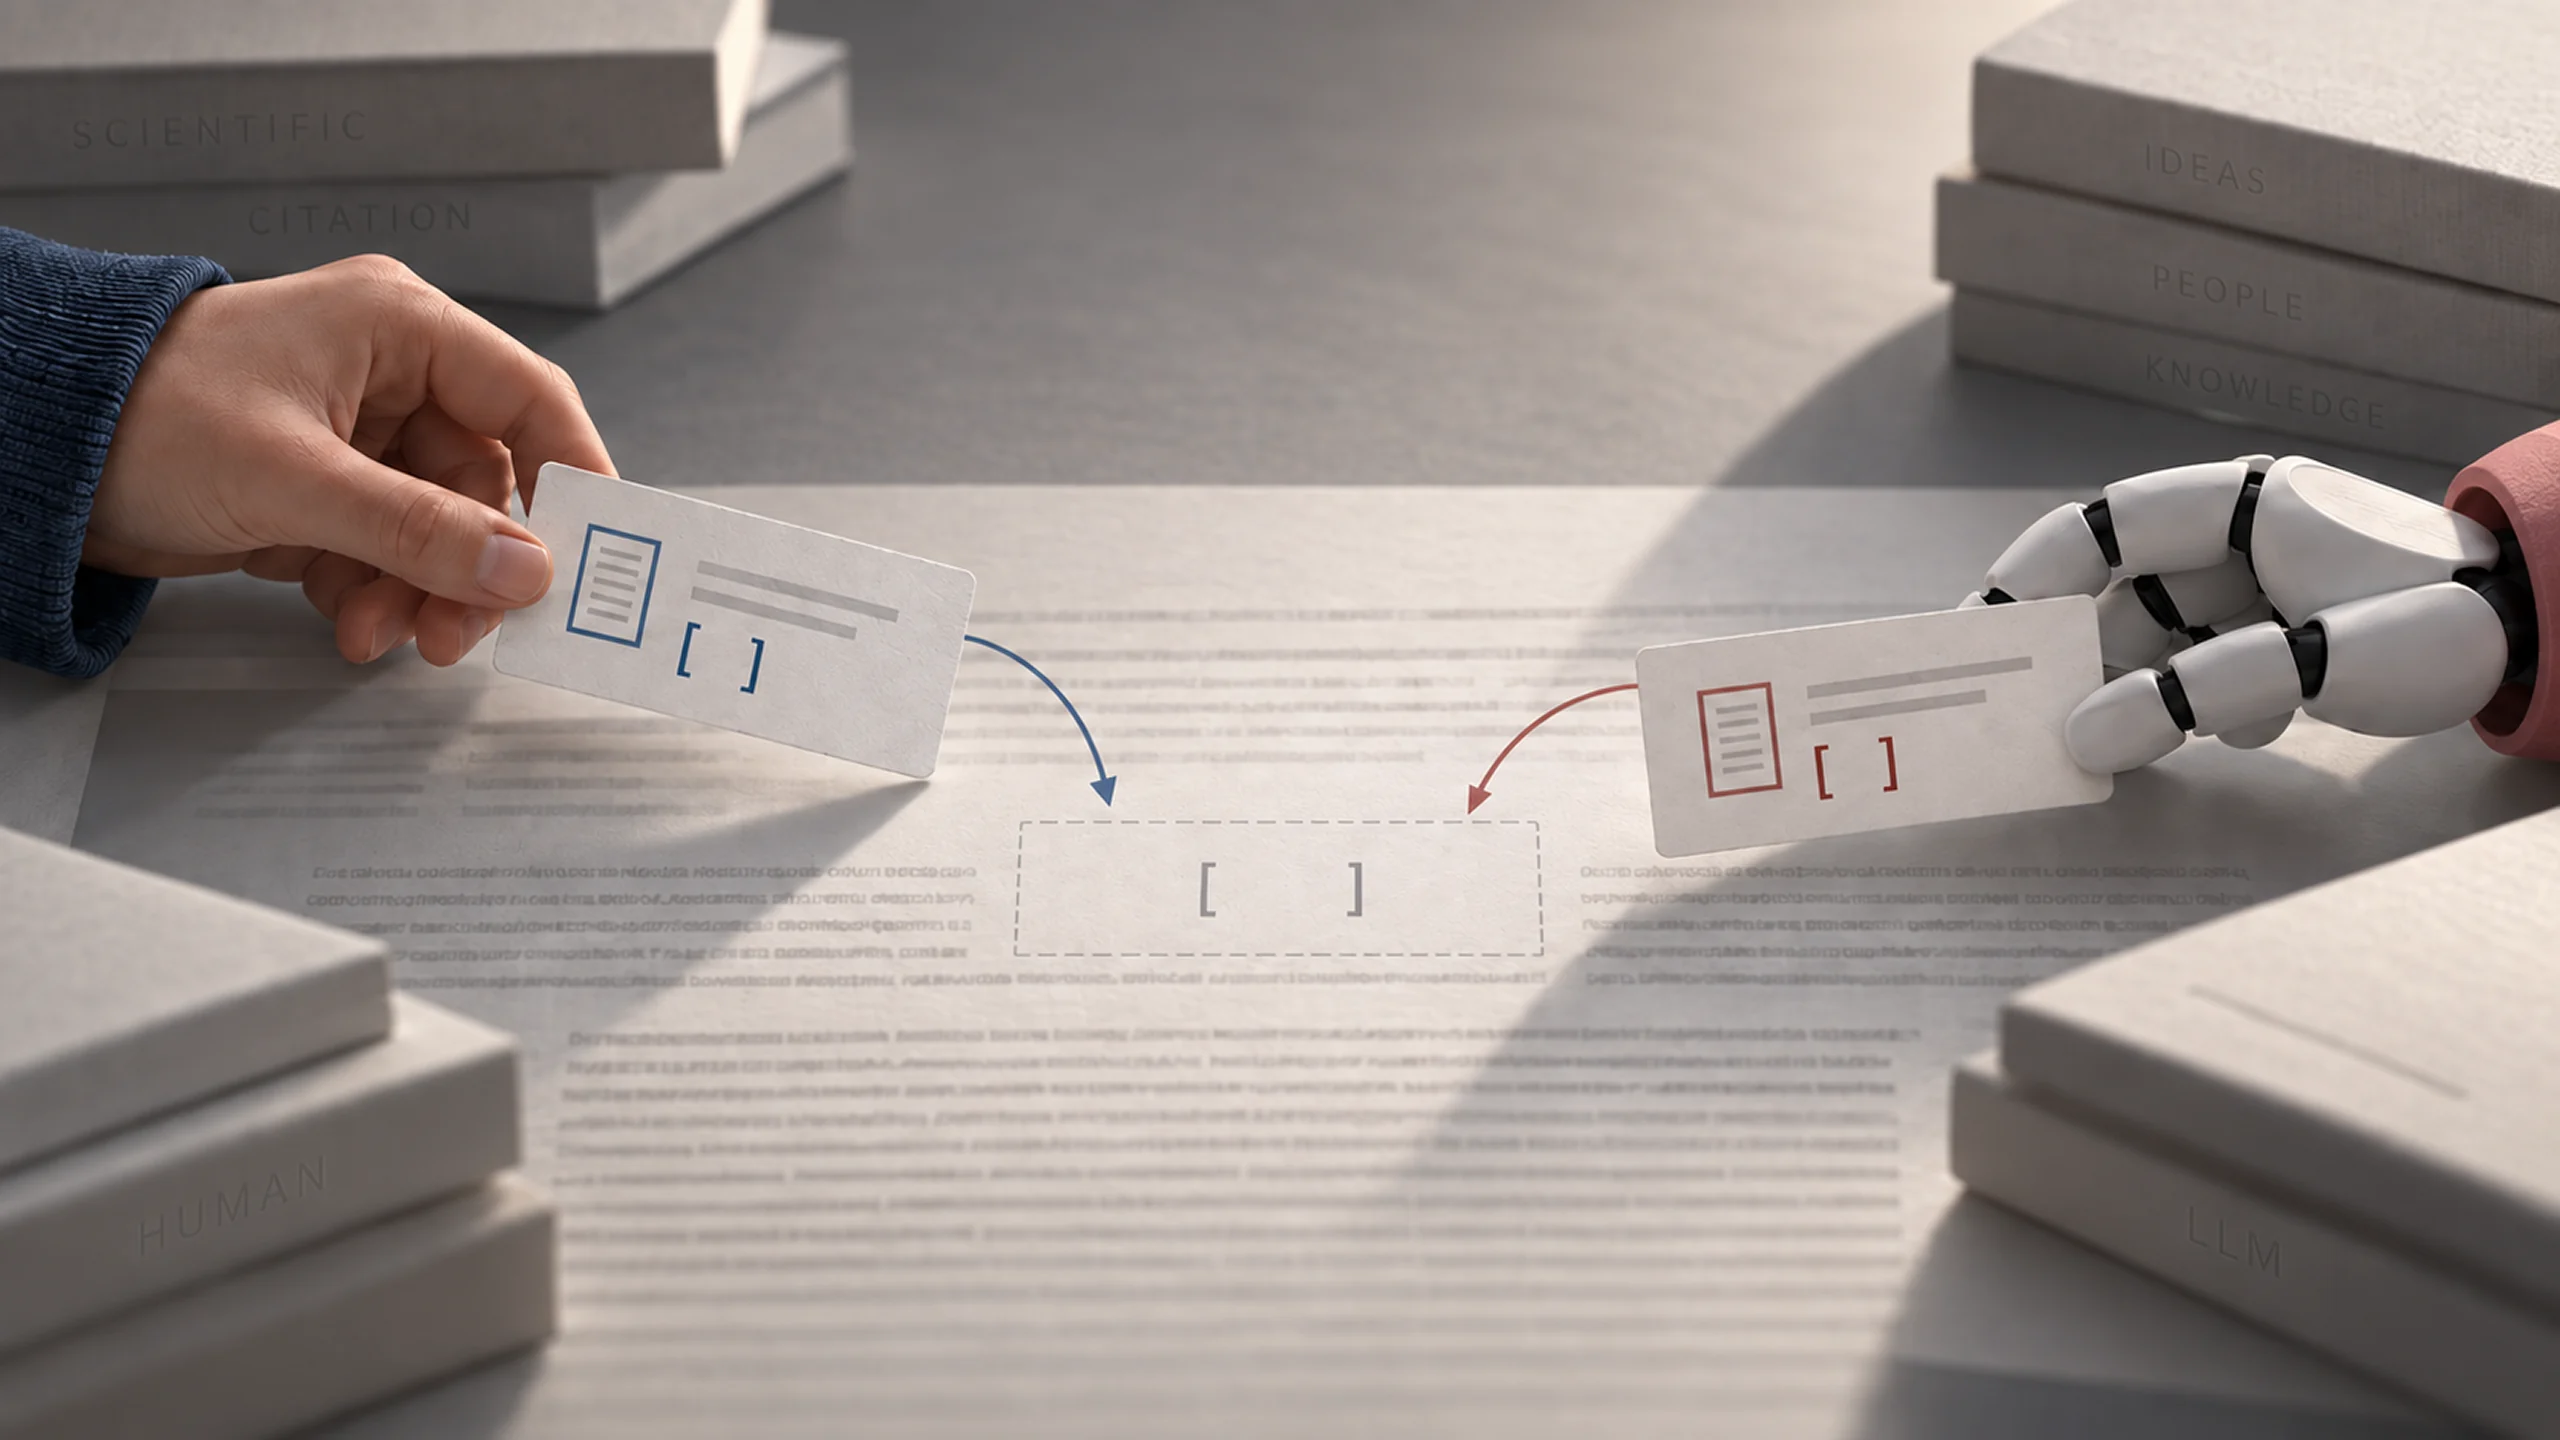
Scientific figure design and citation matching for an EMNLP 2026 study of human and LLM citation behavior.