AI Ethics Network
An interactive tool for exploring keywords, communities, and publication sources in AI ethics literature.
- Svelte
- D3
- SVG
- Timeline
- Jun 2026 – Jul 2026
- Role
- Visualization design, interaction specification, and implementation
- Outcome
- Deployed research tool featured in the team’s manuscript draft
Section
Exploring the research network
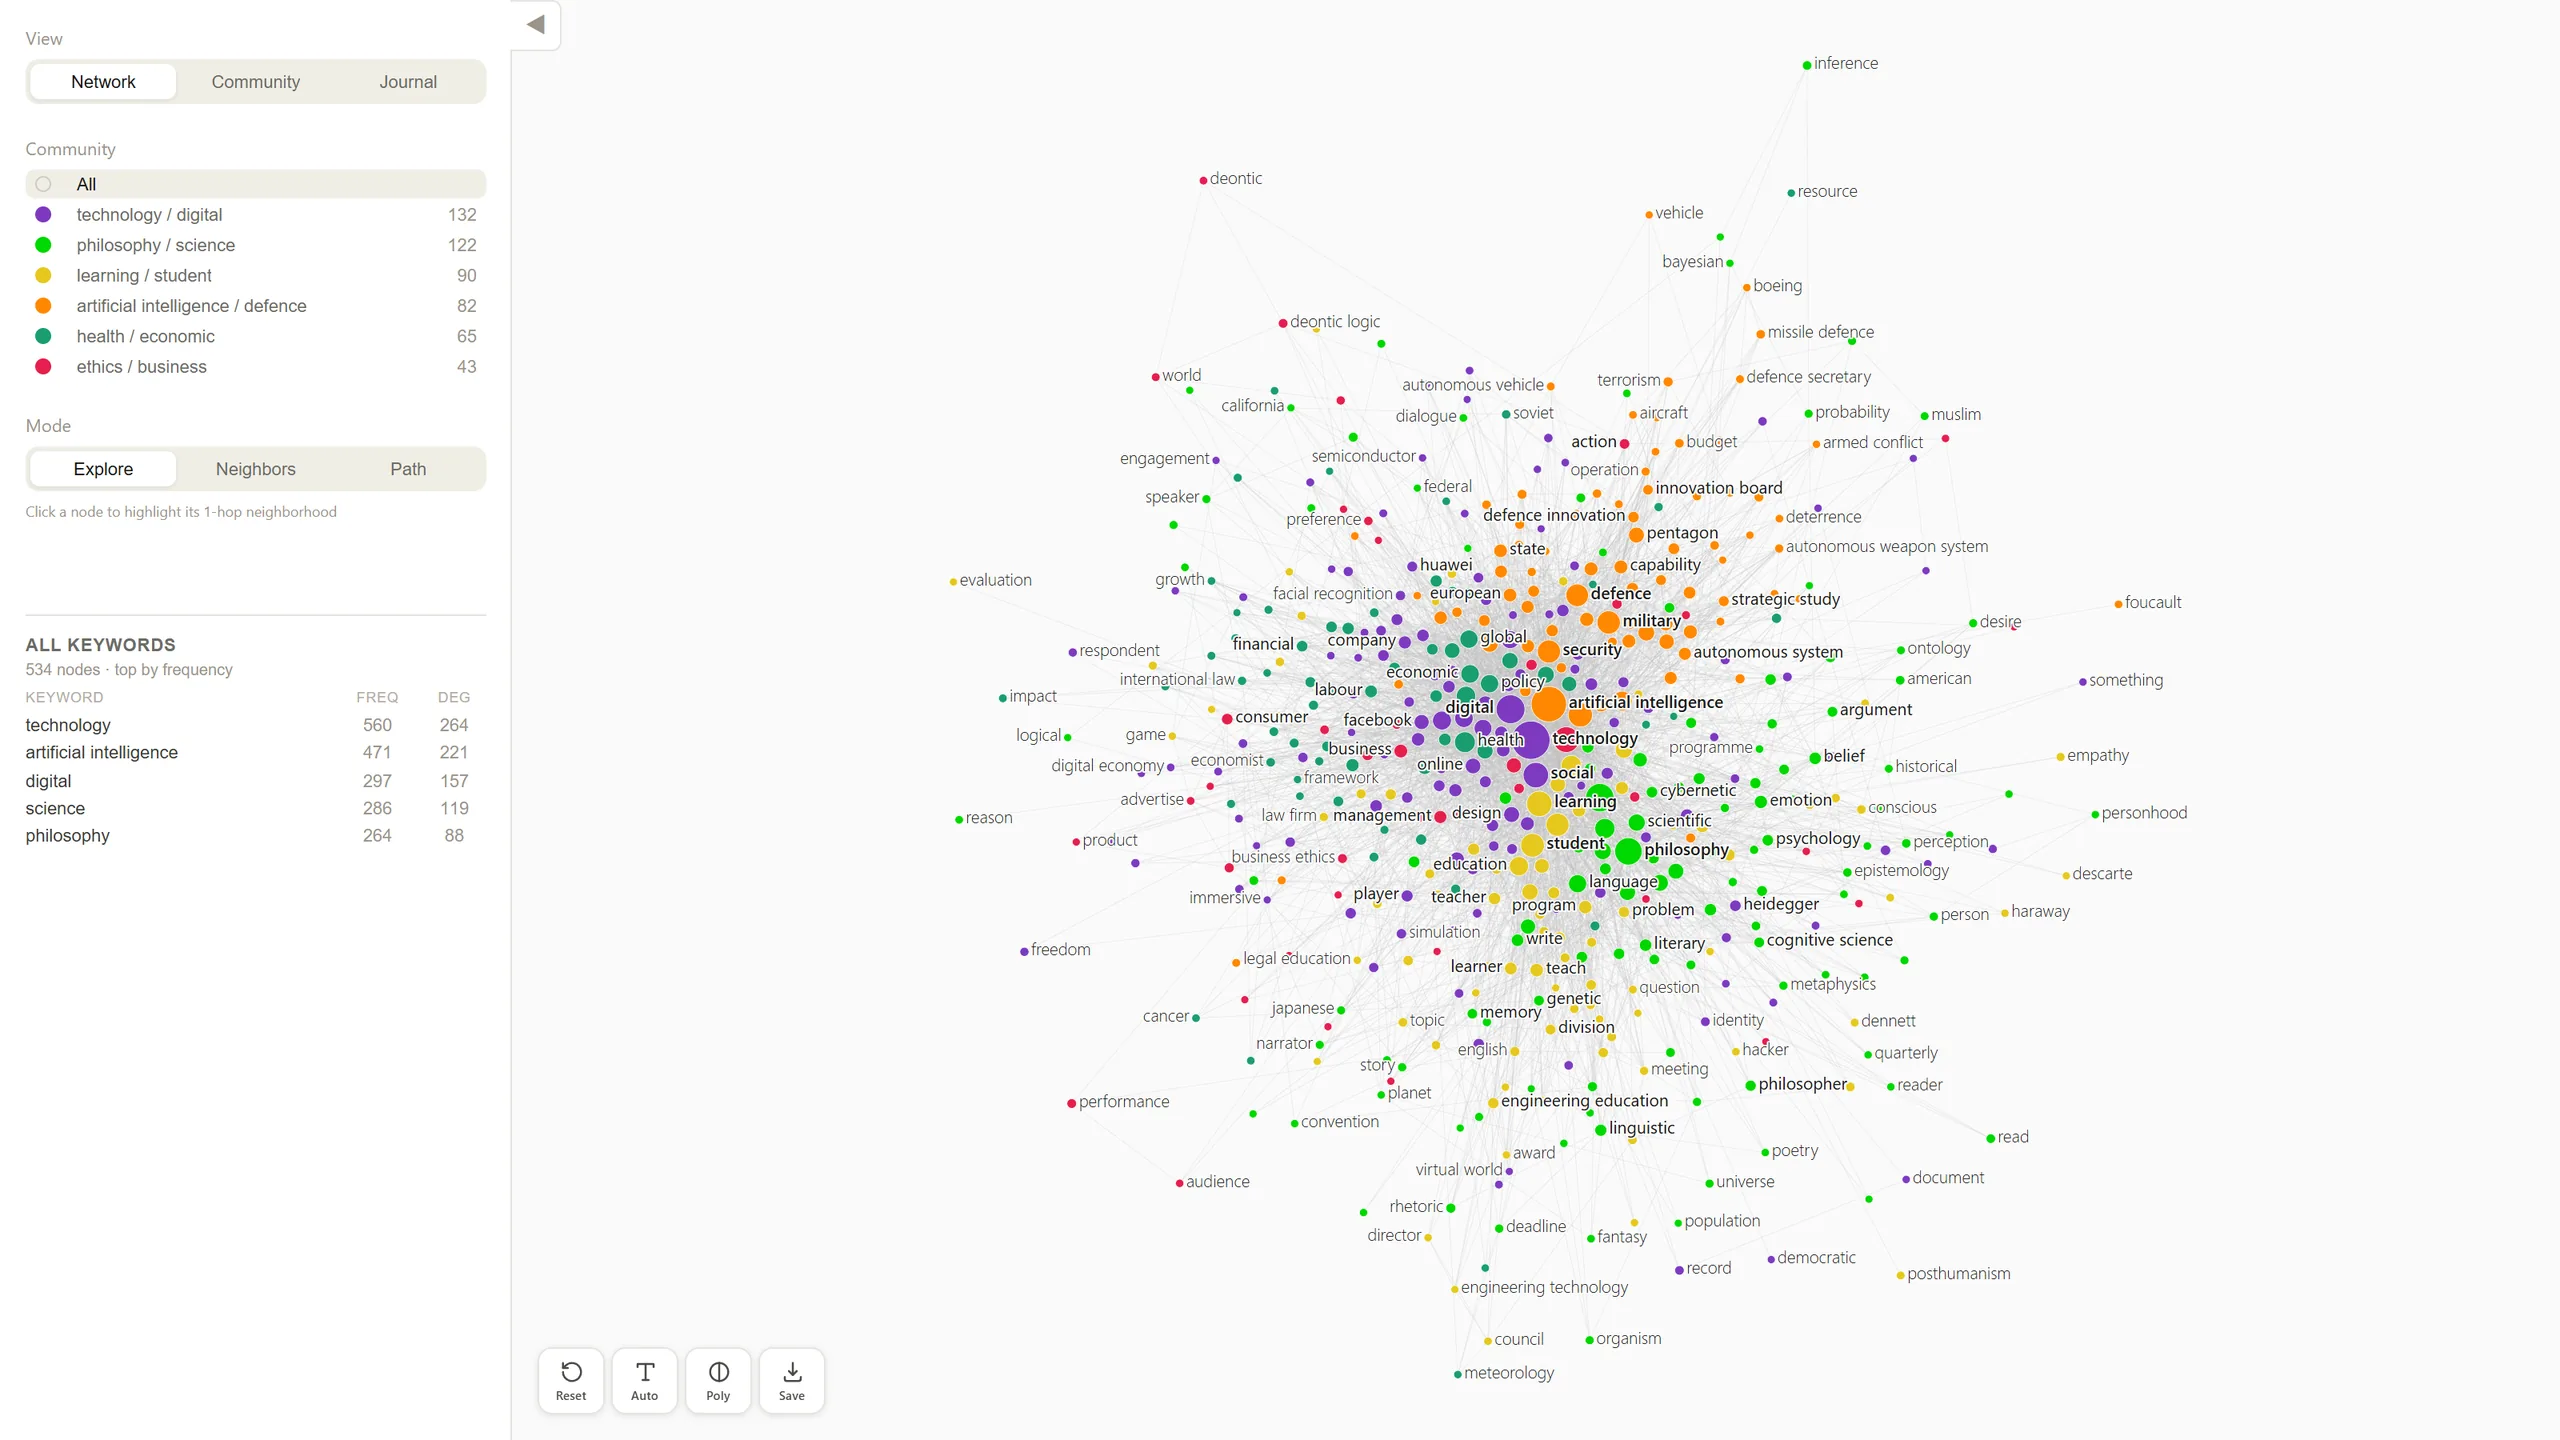
A research team at Northeastern University London had analyzed a JSTOR corpus of AI ethics literature as a set of networks. I designed the views and interactions for exploring its 534 keywords in the browser: their neighborhoods, the thematic communities they form, and the publication sources that carry them.
Data scope
The data is the research team’s own JSTOR corpus and network analysis, downloaded in October 2024. It does not represent all AI ethics literature, or the most recent.
The tool loads two networks: 534 keywords joined by 4,474 links, and a second network joining those keywords to 1,201 publication sources through 9,330 links. Each node carries one connection measure alongside keyword frequency and link weights. For a keyword it is degree, the number of nodes it links to; for a publication source it is total link weight, the sum of the weights on its links, sometimes called weighted degree or strength. The team’s upstream analysis also produced other centrality scores, which the tool does not load.
Choosing the views
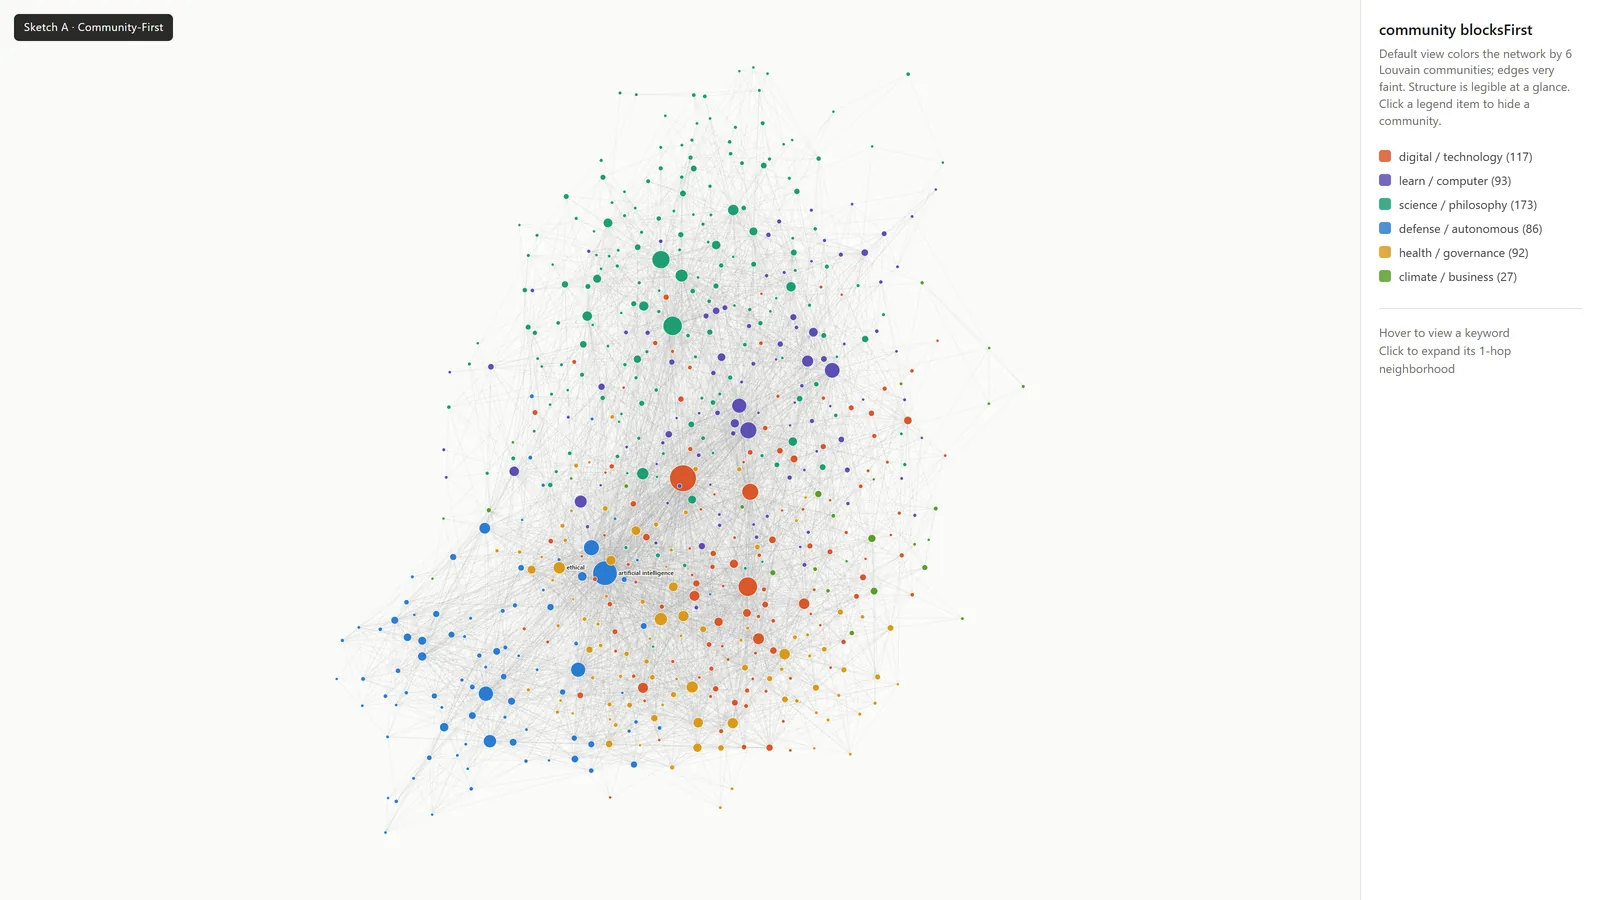
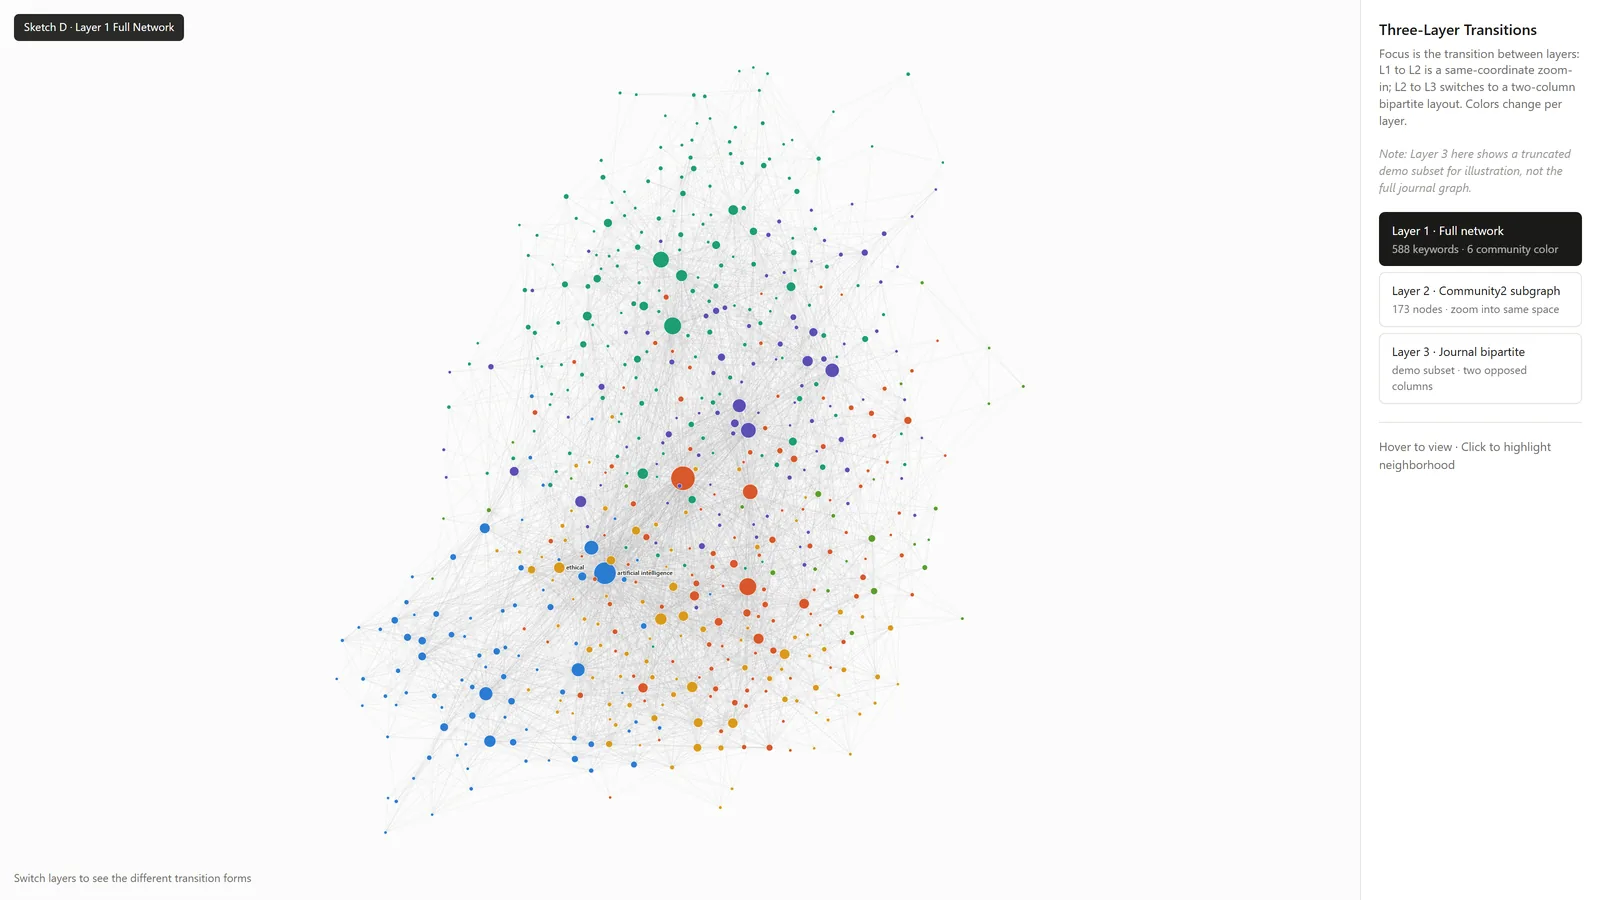
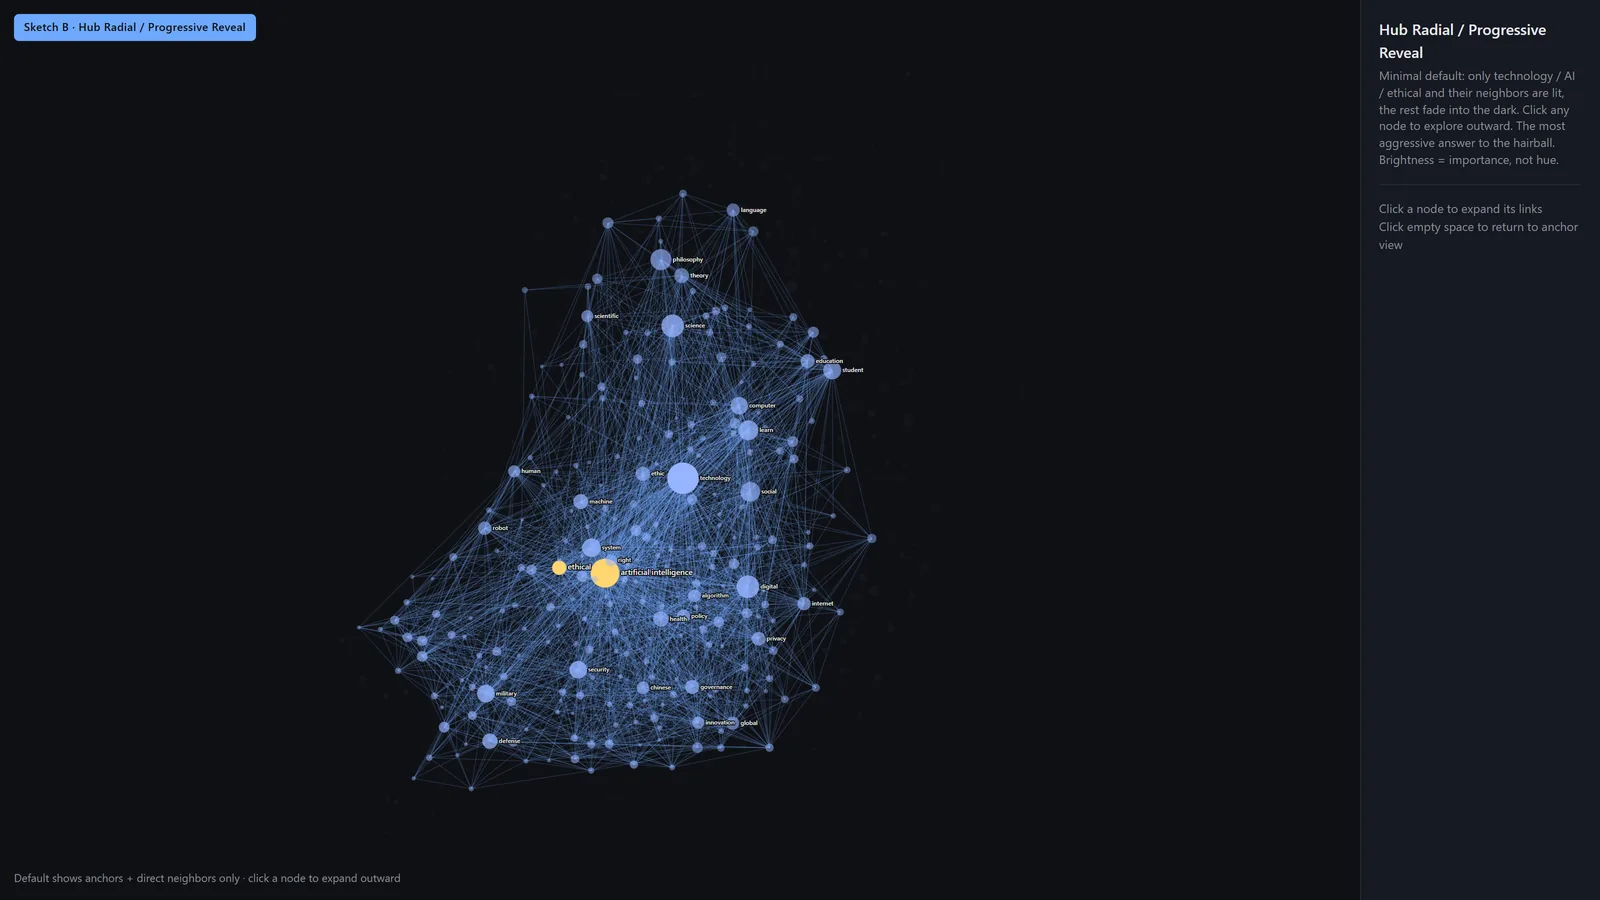
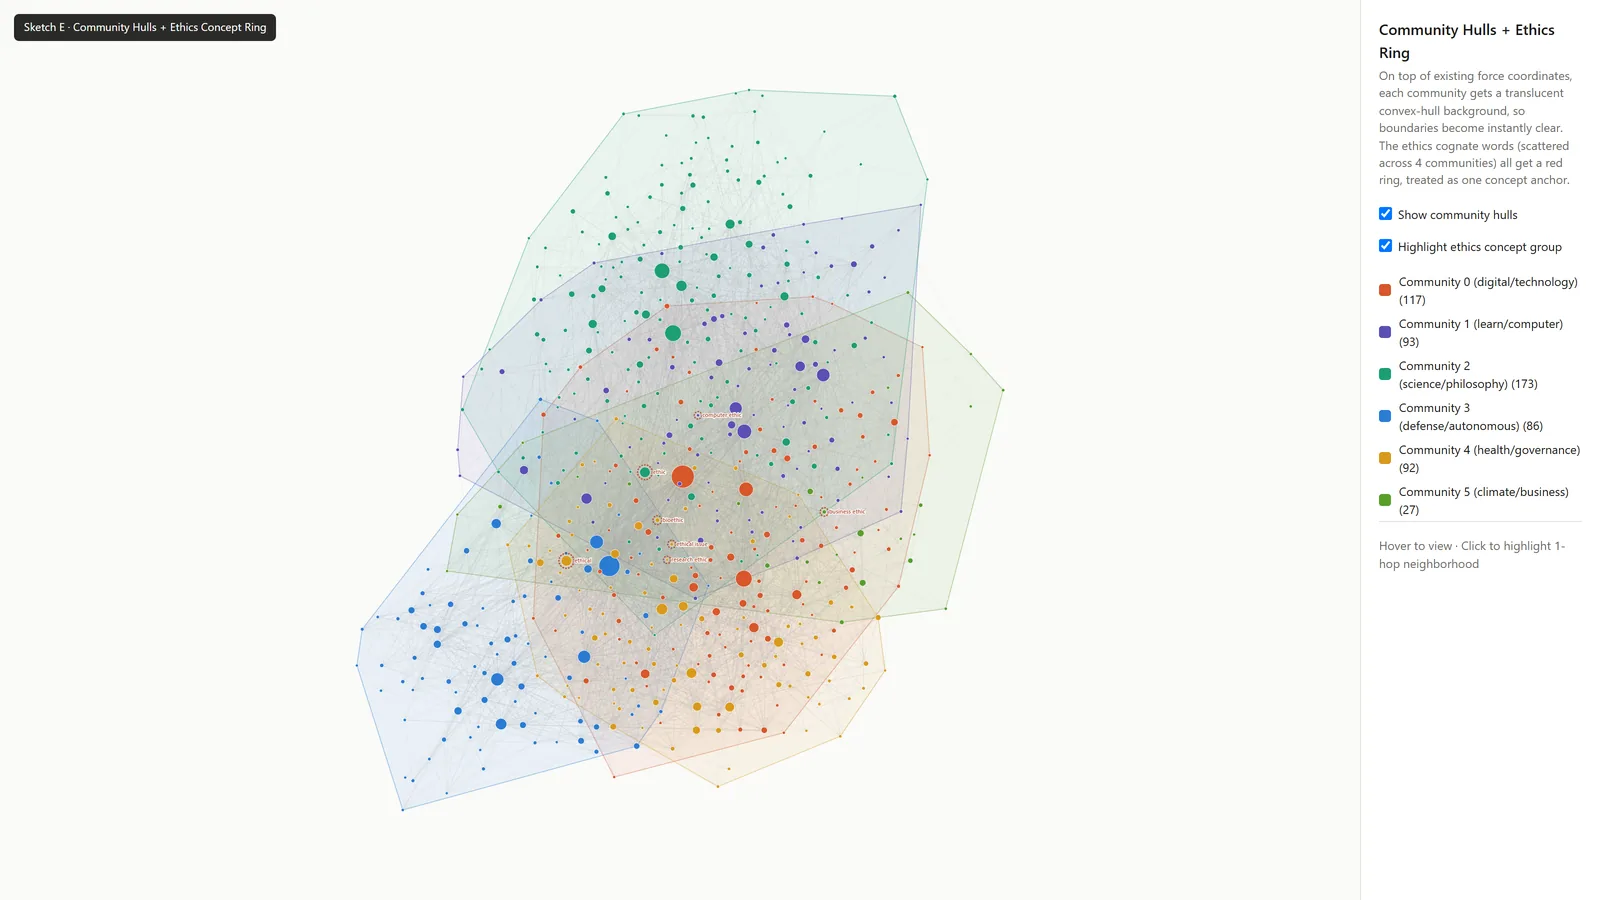
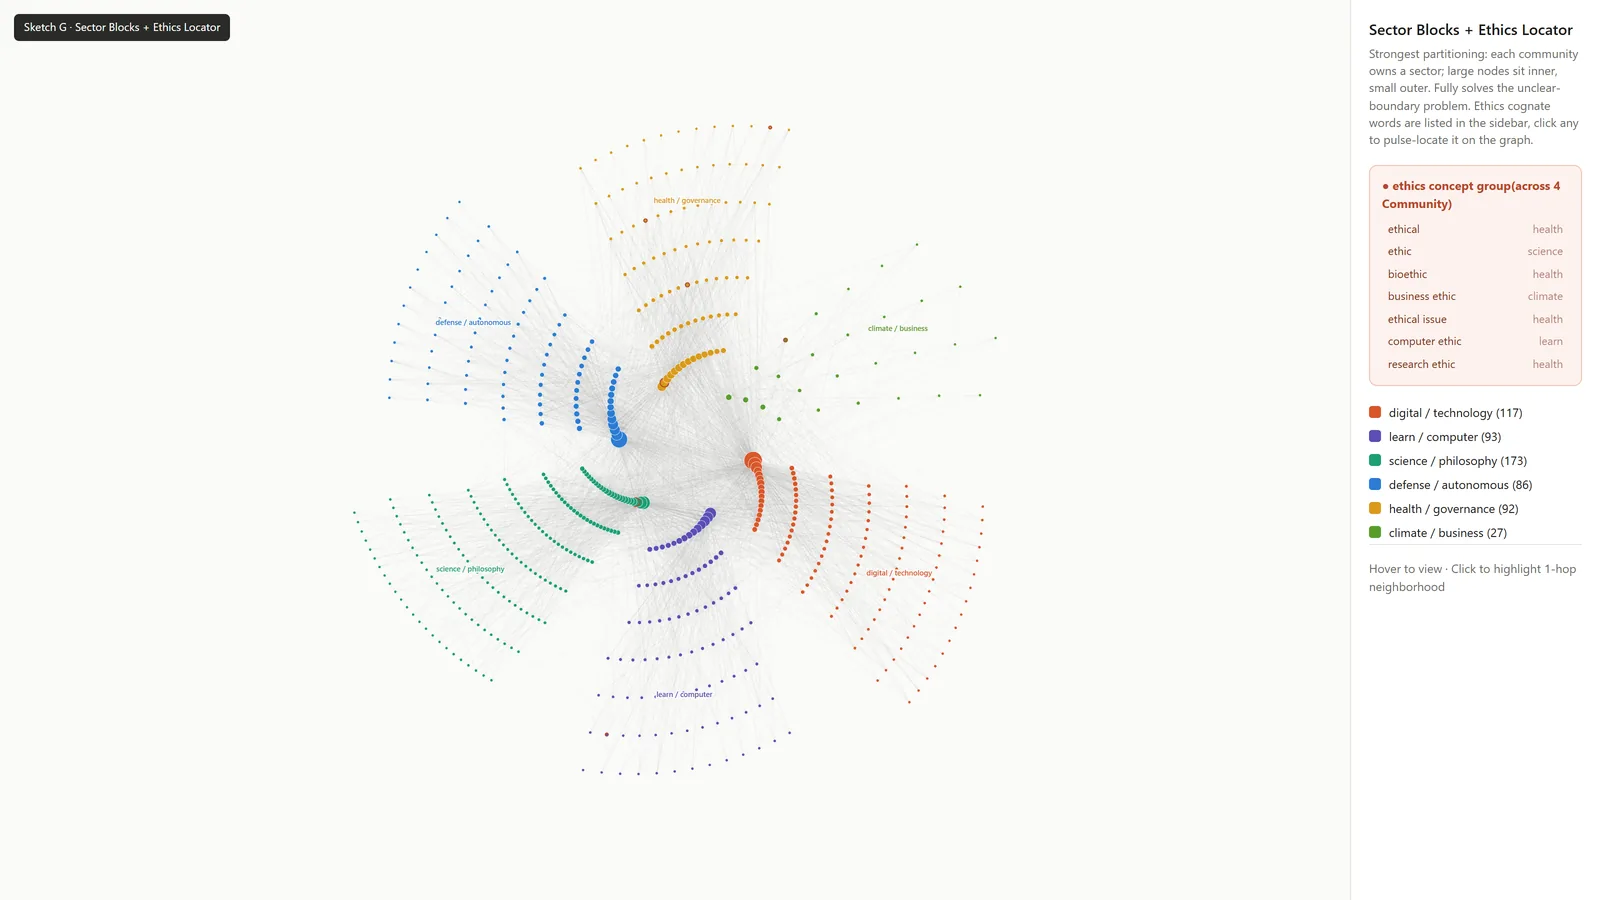
I made seven working sketches on the real network data to explore how researchers could navigate it. The team’s feedback clarified which capabilities mattered, and I used that input to decide what needed a separate view, what belonged within a view, and what could become a display option.
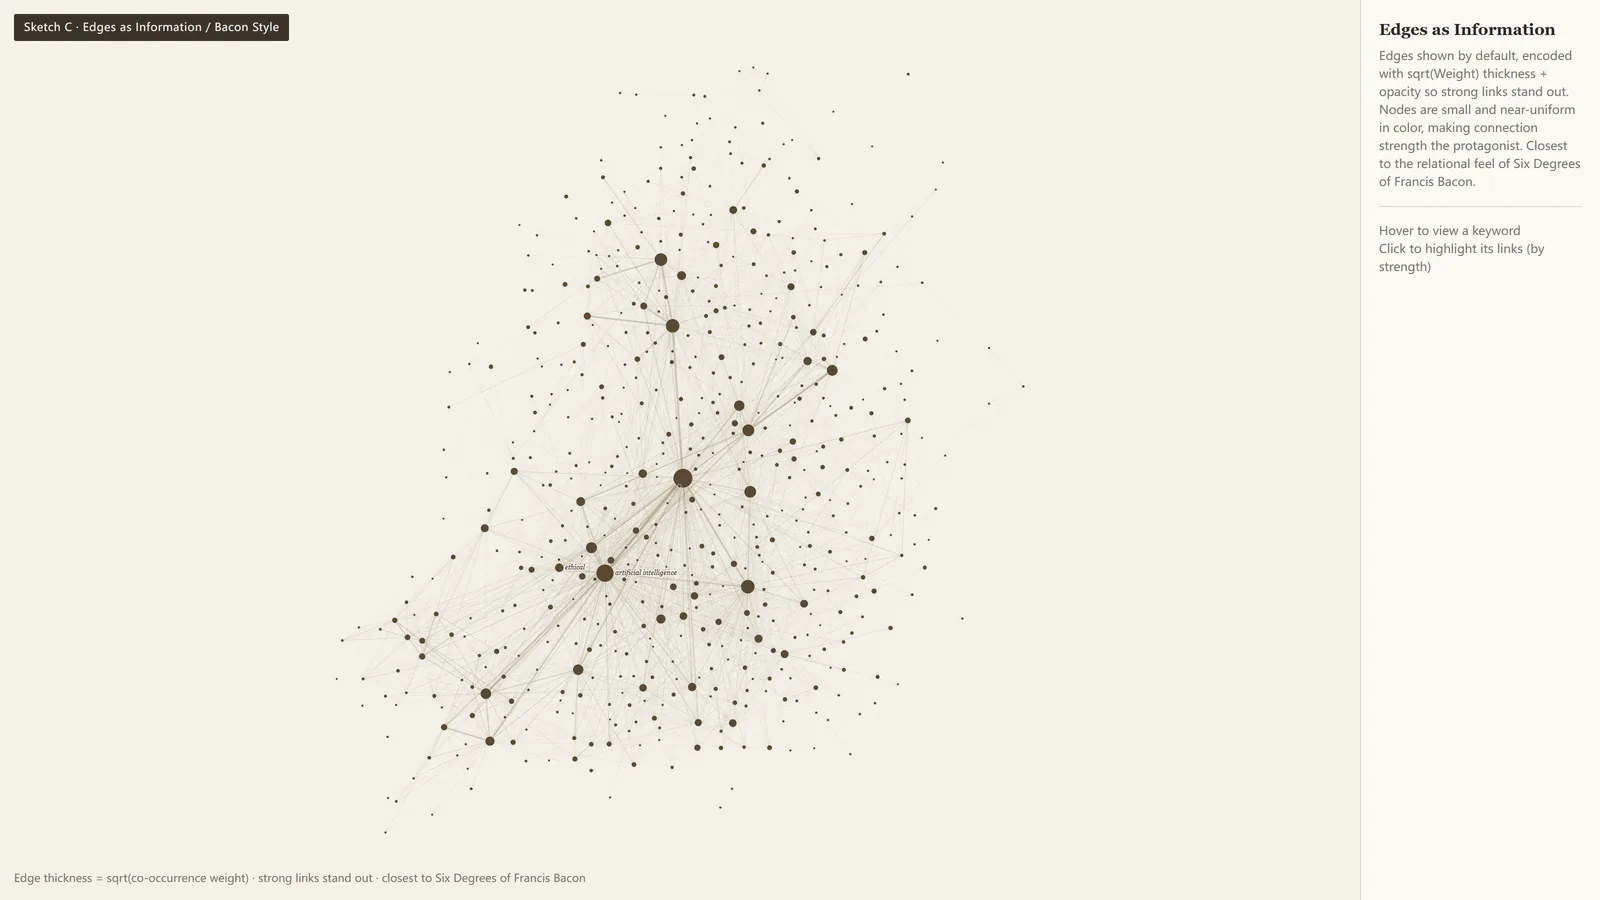
Two views of the same network
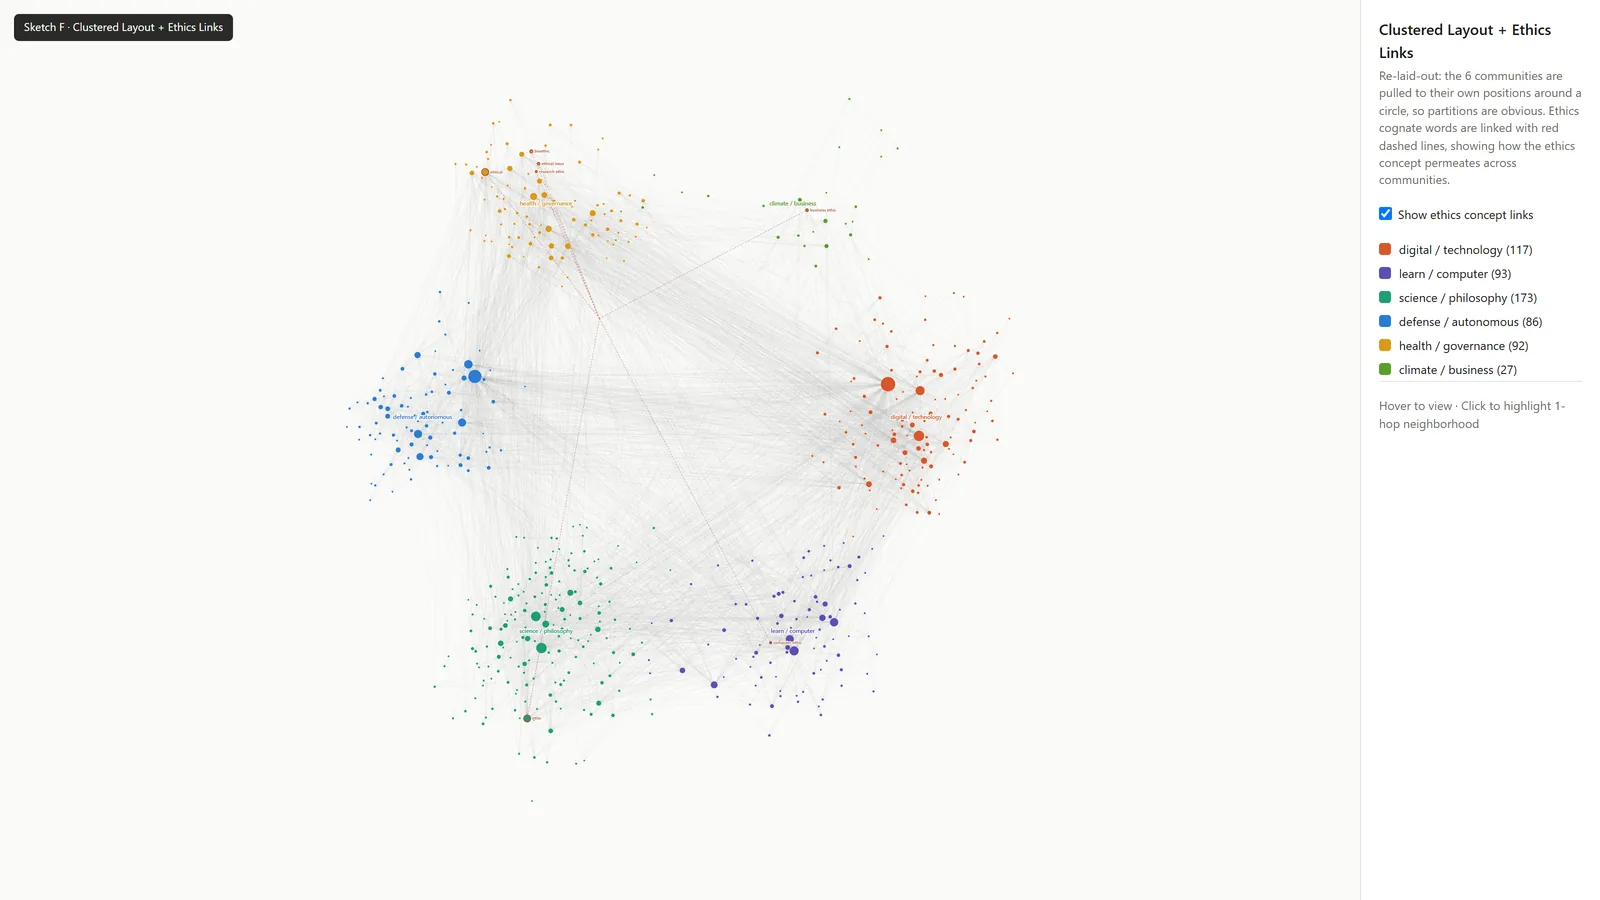
I kept Network and Community as two views of the same keyword network. Network preserves the overall layout for browsing connections. Community separates the six top-level communities, each keeping its internal arrangement, to make their structure easier to inspect.
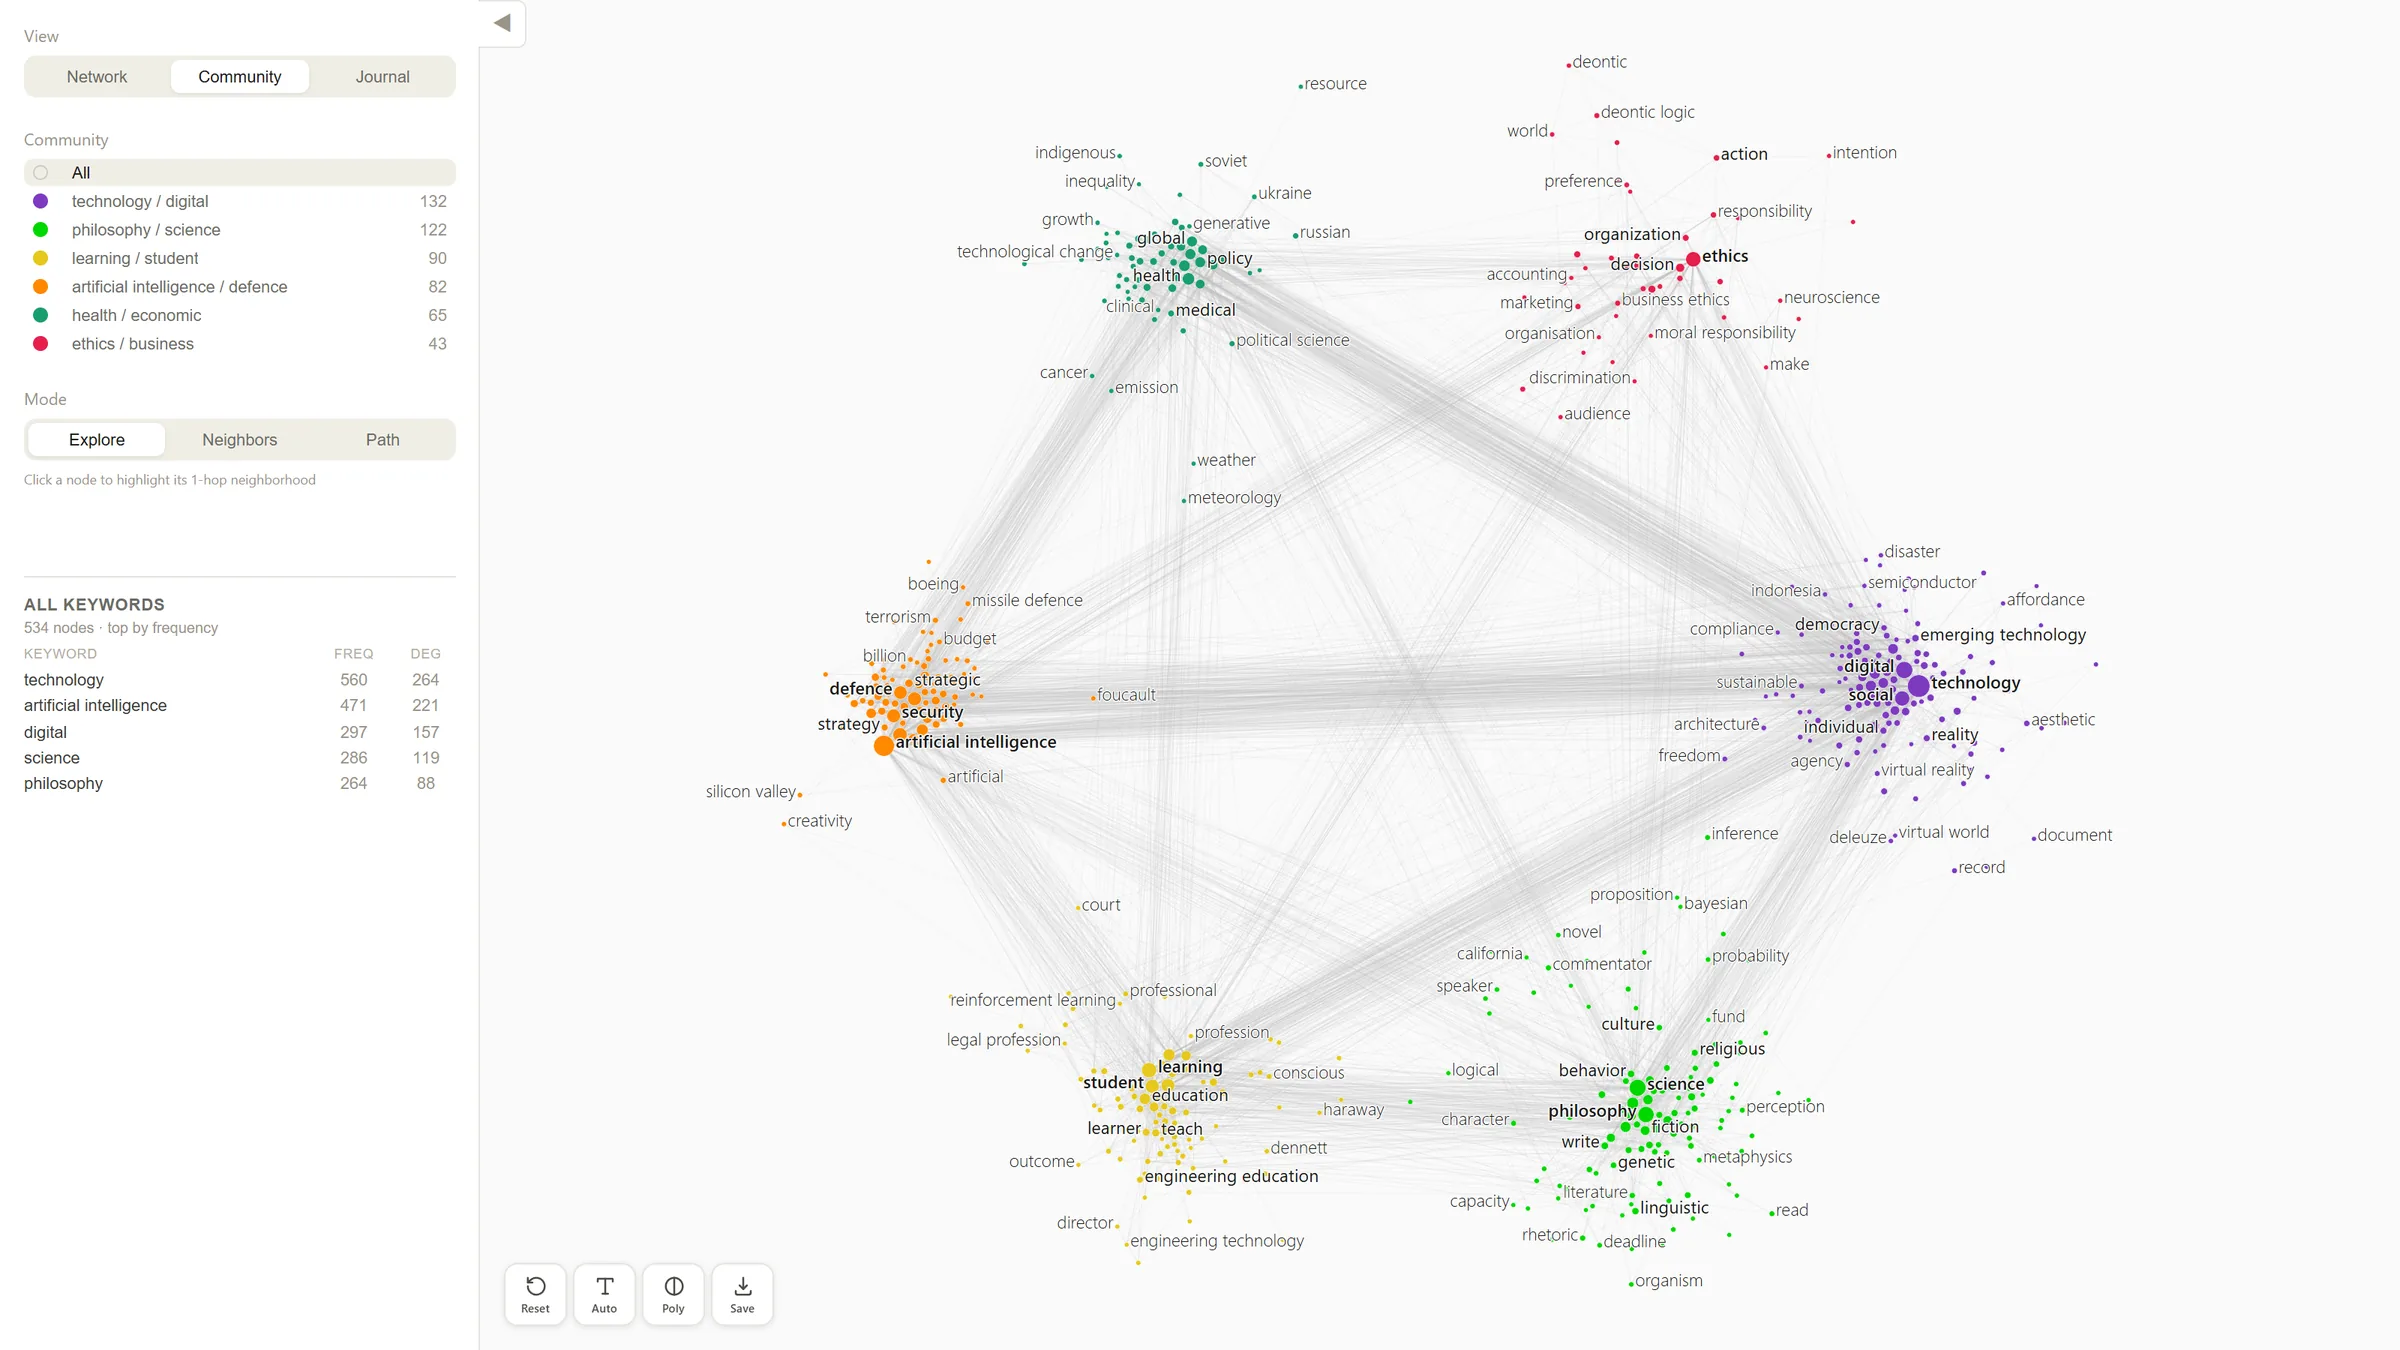
A separate view for publication sources
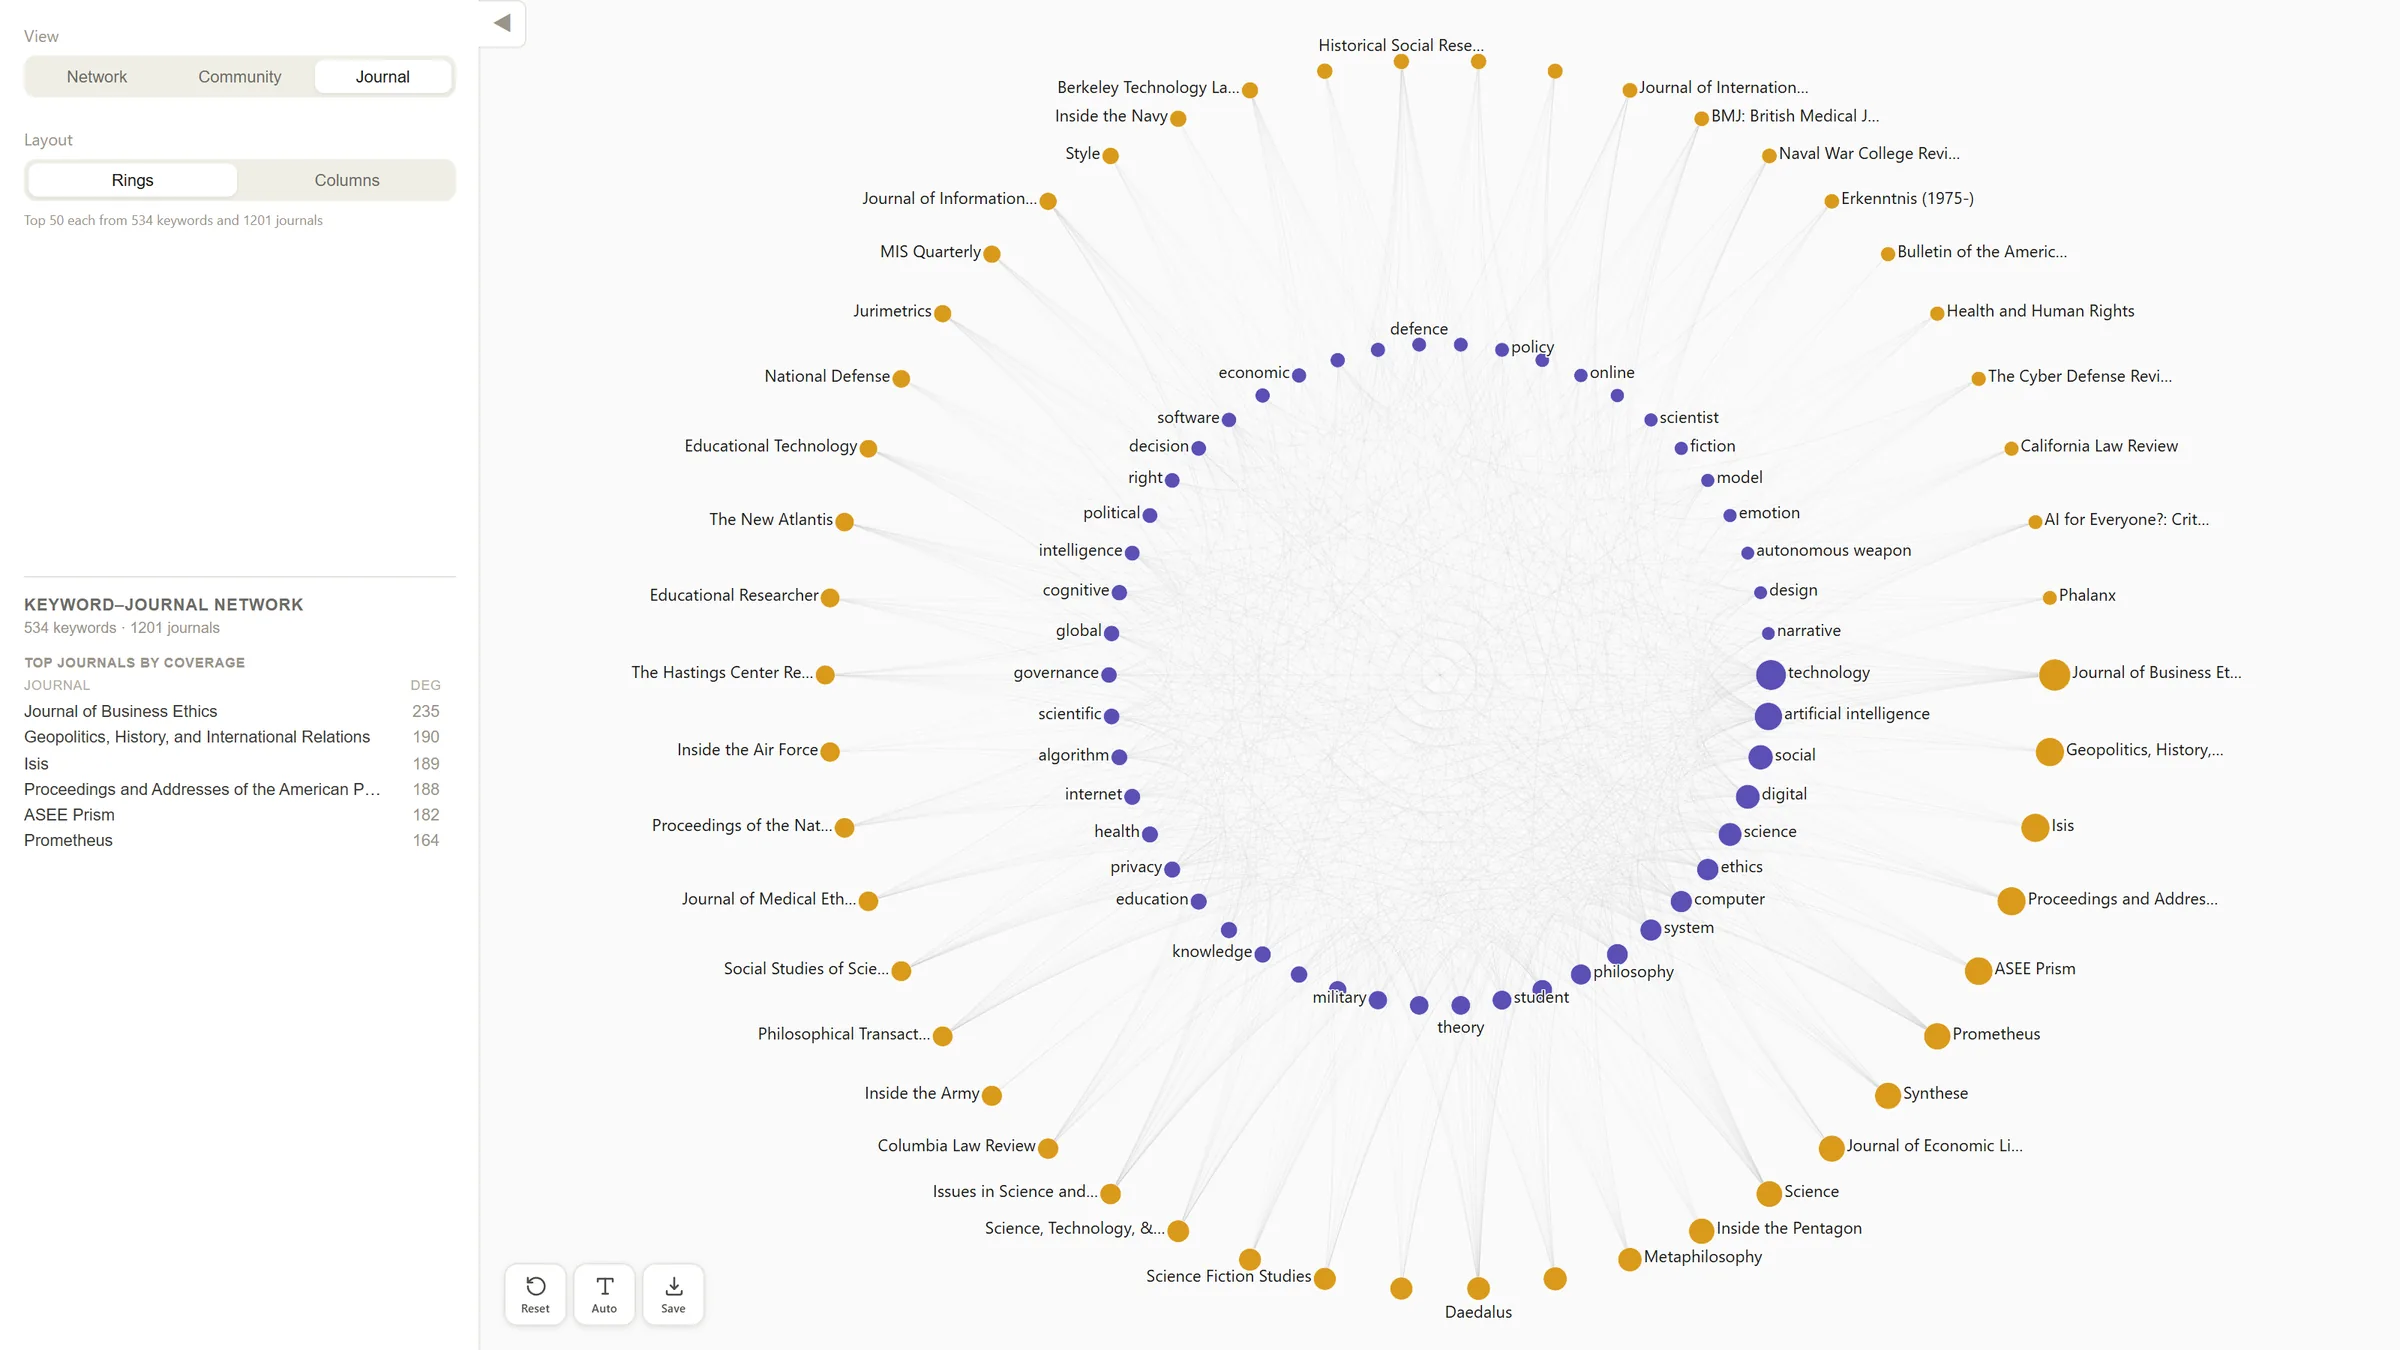
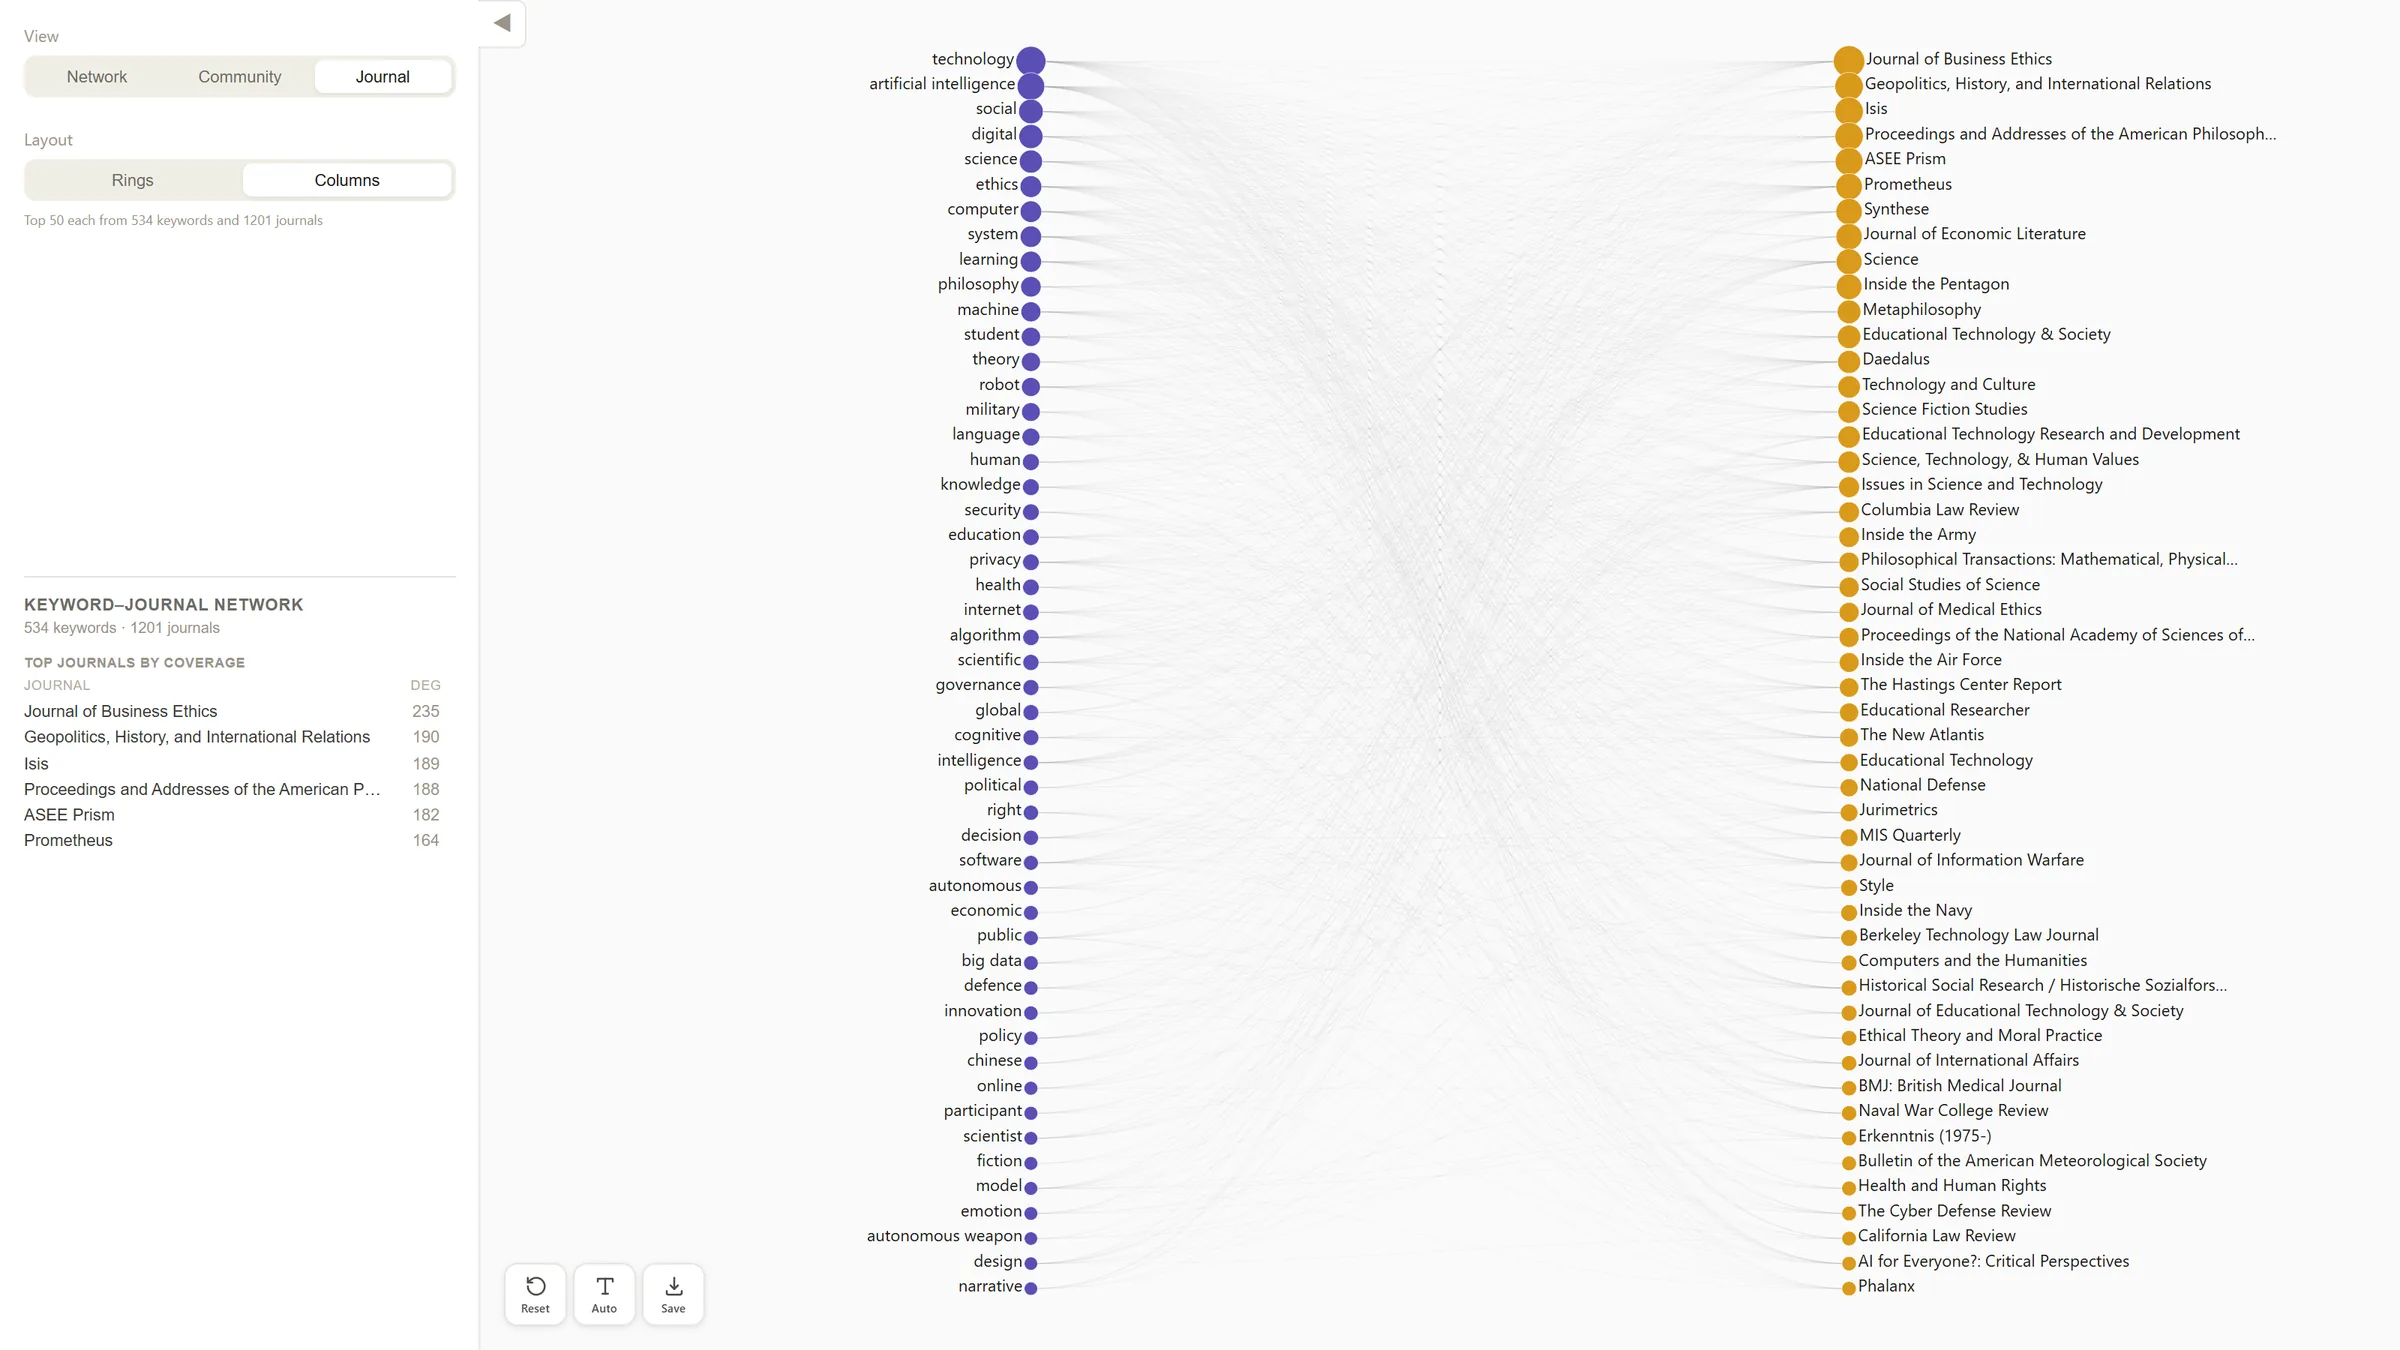
I gave the keyword-to-source network its own view, Journal, because it connects two different types of entities. Within Journal, I made Rings and Columns alternative layouts of that relationship.
The view shows a ranked subset of 50 keywords, ordered by how many publication sources each links to, and 50 publication sources, ordered by total link weight. I settled on 50 by trying the layouts and judging legibility, visual density, and how the view responded in use. It is an empirical choice with no measured threshold behind it, and because the lower-ranked nodes are left out, the view is not the complete network.
A color mode instead of another view
I kept Lattice’s single-color approach as a color mode within the existing views. It changes how the network looks and introduces no new relationship or exploration task.
Additional sketches and feedback
Brian Ball, one of the principal investigators, replied in writing on June 27, 2026. He suggested combining the capabilities of Atlas, Strata, and Orbit, asked to keep Lattice, and wanted the keyword-to-source network available on its own. Organizing those into two views of one network, a separate Journal view with two layouts, and a color mode was my design response.
On the three sketches that did not carry forward, he found Nightfall’s marks and type too small, and zooming in on his screen enlarged the text more than the graphics. Territory repeated a static view that Rafael Morris had already made from the analysis. Compass struck him as interestingly different, though he was not sure it showed anything the other layouts could not.
Following keywords and connections
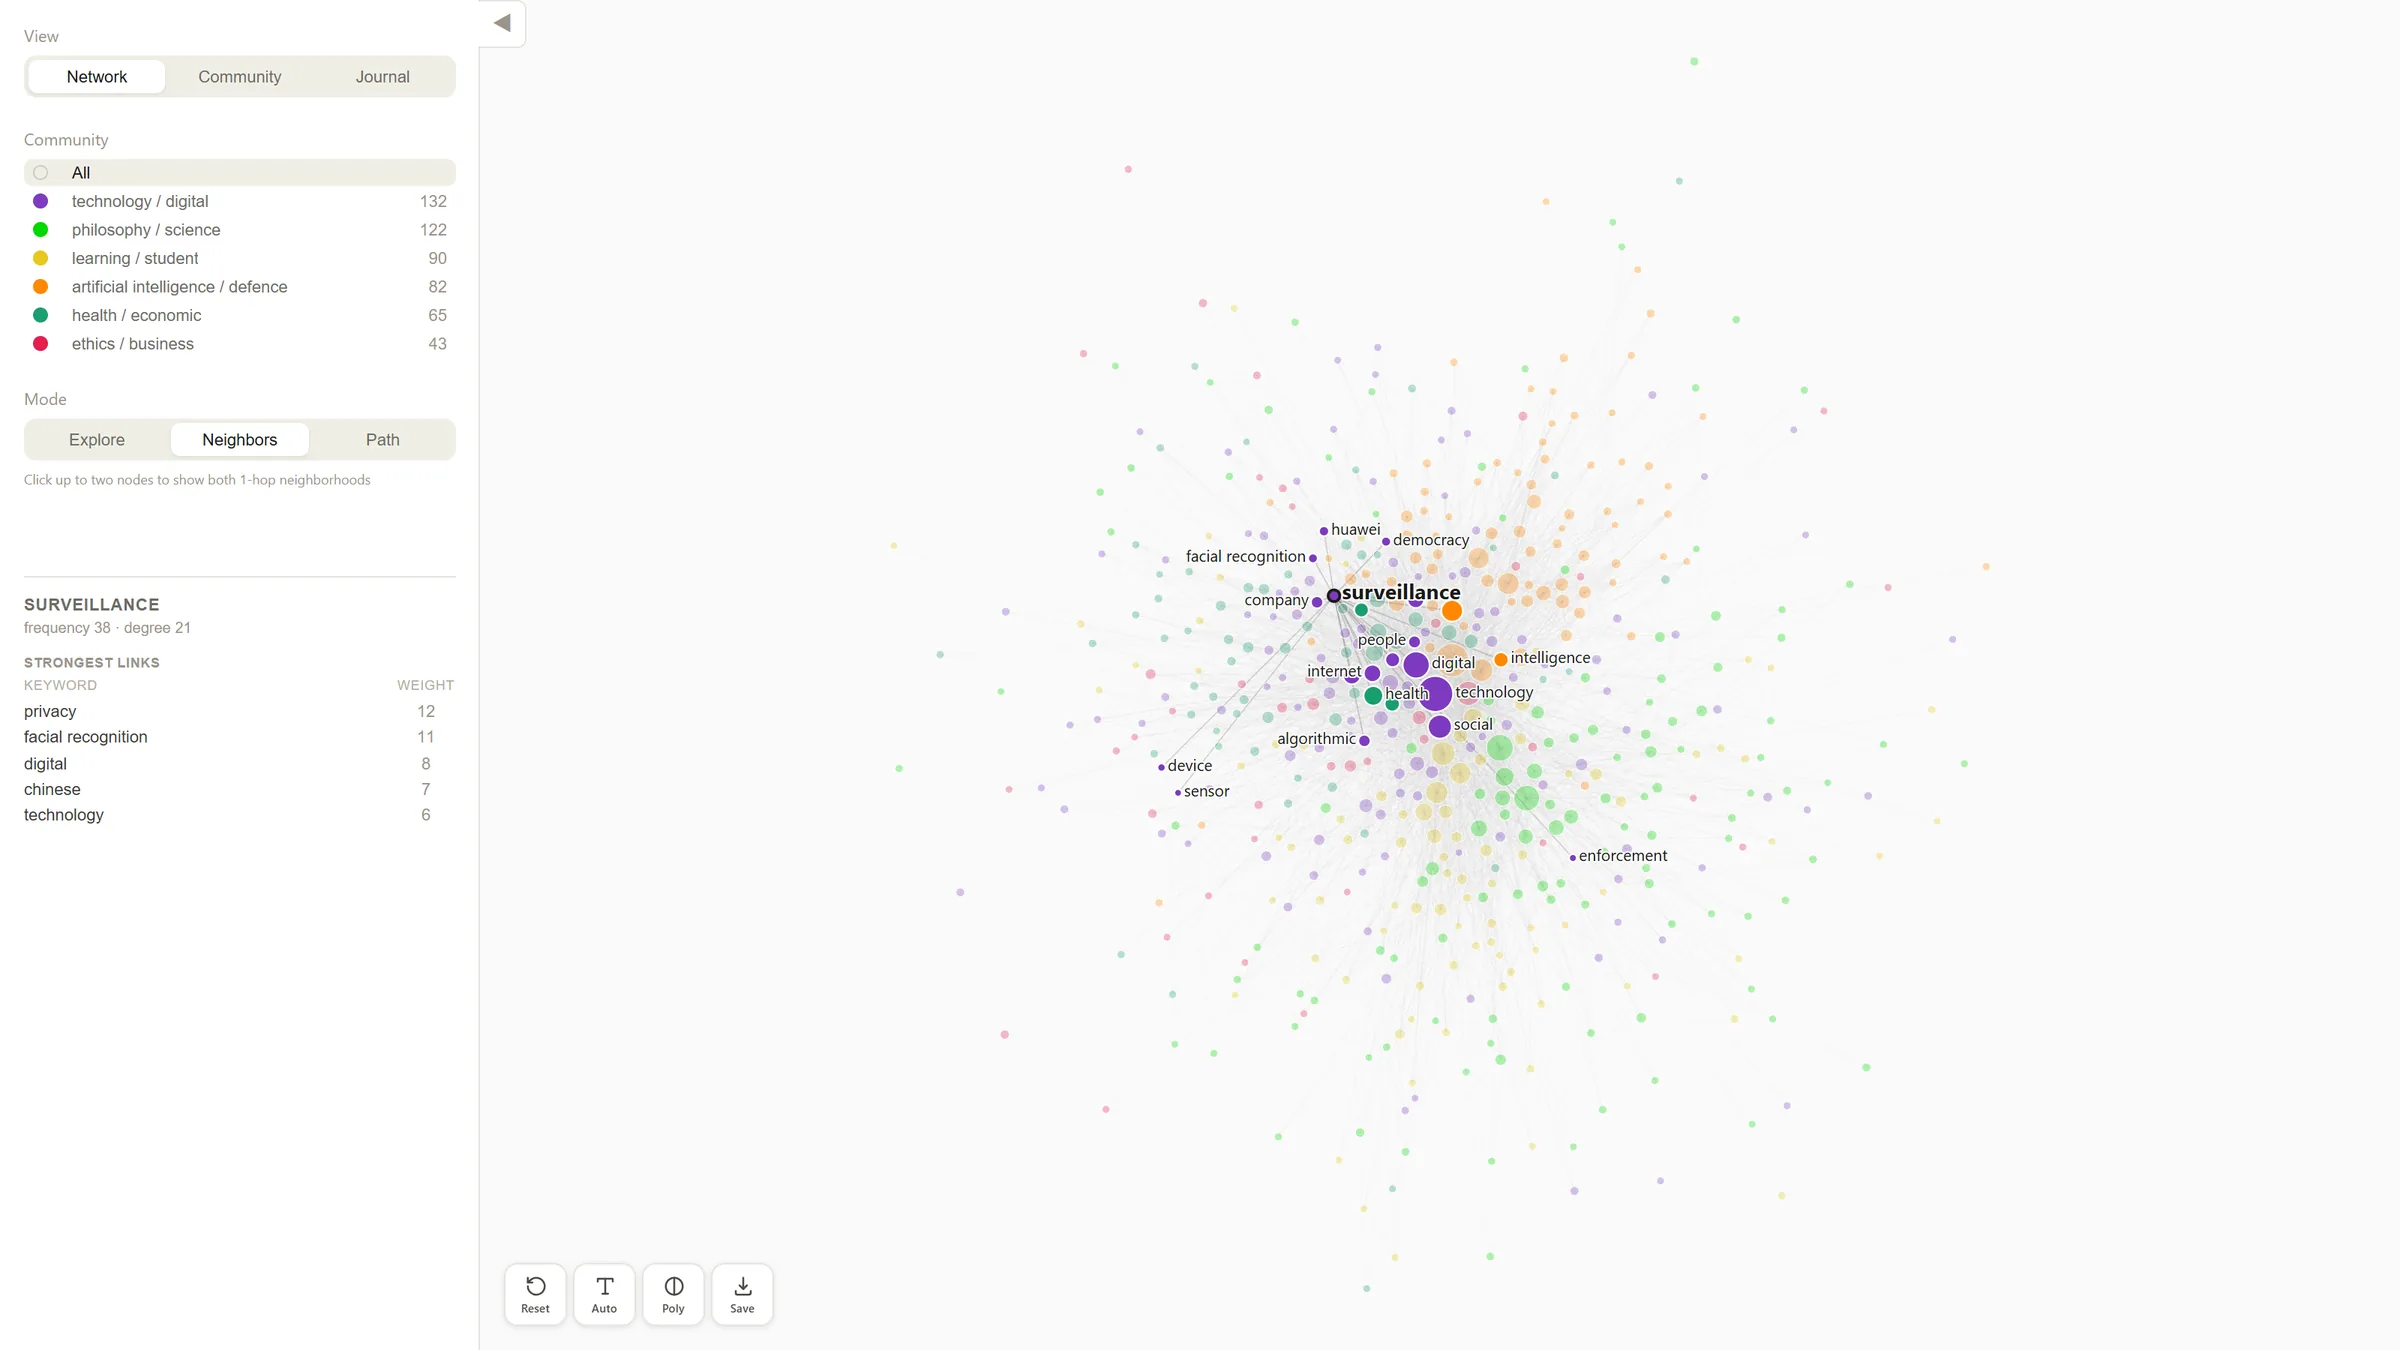
I organized exploration into three modes: inspecting one keyword’s neighborhood, viewing two neighborhoods together, and tracing a connecting path.
| Mode | Selection | What it reveals |
|---|---|---|
| Explore | One keyword | Its direct neighbors and the links to them |
| Neighbors | Two keywords | The union of both neighborhoods, including neighbors they do not share |
| Path | Two keywords | A chain with the fewest links between them |
Path is available in the Network and Community views only.
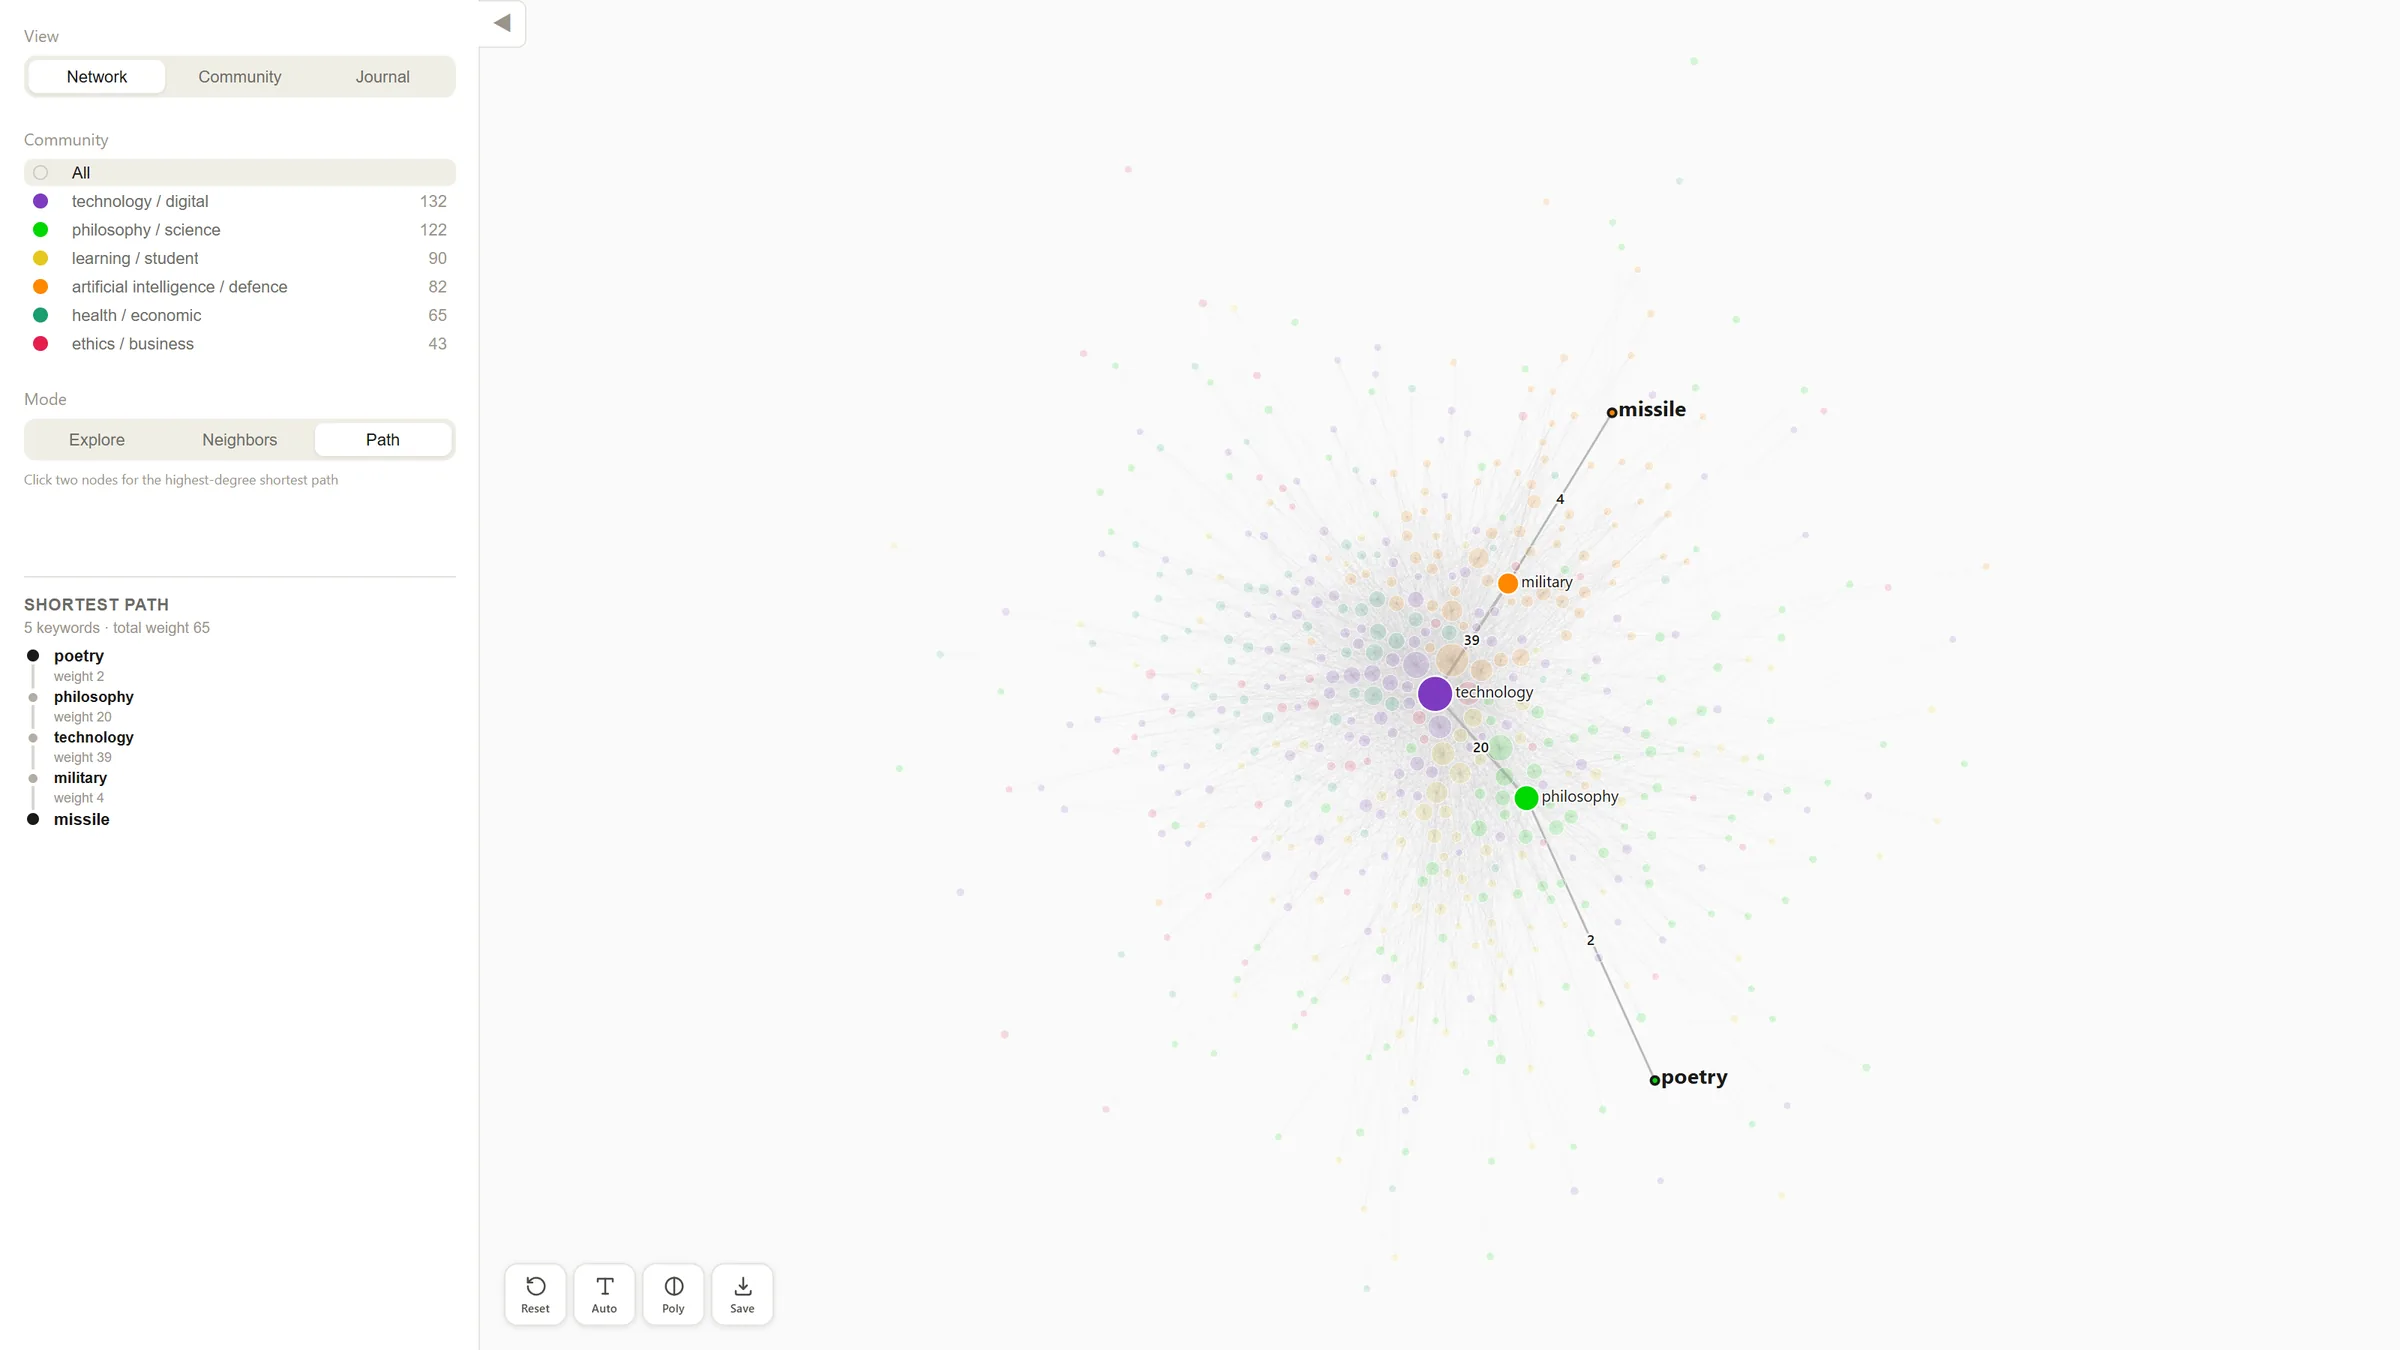
Among equally short paths, Path picks the one whose keywords have the highest total degree. I chose degree because it is a familiar network measure, hoping the path would pass through well-connected keywords a reader is more likely to recognize, though a high degree does not guarantee that. A path does not measure semantic distance, the strongest association, or scholarly influence. Both examples demonstrate the tool and are not research findings.
How the path and its numbers are computed
A breadth-first search finds the shortest distance from the first keyword to every other. Among the links that lie on a shortest route, the tool then keeps, for each keyword, the route with the highest running sum of degree, and traces back from the second keyword. Link weight plays no part in choosing the path.
The sidebar shows each link’s weight, the number of papers the two keywords share. It also sums those weights along the path. That total is not a count of distinct papers, because the same paper can be counted on more than one link.
In the Network and Community views, node size follows keyword frequency, which also orders the sidebar lists by default. Degree in the keyword network sets which labels are shown first and breaks ties between paths of the same length. Link widths in some selected states come from the average degree of the two ends, and the resting network draws every link at one width, so a thicker line does not mean more shared papers. In the Journal view, a keyword is drawn, sized, and ordered by the number of publication sources it links to, and a publication source by its total link weight. Link weight orders the sidebar and labels the highlighted links there, and line width mainly marks what is selected. Distance on screen is not an exact measure of how strongly two nodes are related.
Stable layouts and editable figures
I chose precomputed layouts to keep node positions stable between visits and to reduce waiting and movement when the tool opens. The coordinates are saved ahead of time in the data file the tool loads, so every keyword is already in place.
To support further figure editing, I specified SVG export that preserves the current selection, highlighting, fading, and label styling. The file holds the canvas alone, without the sidebar or the rest of the page, and I tested the export on the deployed tool.
Implementation notes
The tool is a single-page Svelte application that renders to SVG and is deployed as a static site. Svelte holds the interface state: the view, the mode, and the selection. A Node script lays the network out with d3-force and saves the coordinates; in the browser, the tool only nudges overlapping nodes apart, because node size is applied after the layout is computed. The Community view reuses those coordinates, moving each community to a point on a circle, and the Journal view computes its own positions from the ring or column it is drawing.
Labels are placed in order of each node’s connection measure, and a label that would collide with one already placed is dropped. Export clones the live SVG, adds the label styles, serializes it, and downloads it named after the current view.
Research use and remaining limits
The tool is deployed, and the team’s manuscript draft, which is not yet published, introduces it in its own section with examples of exploring the network.
Search and tracing connections back to individual papers remain unfinished; the tracing needs a mapping from papers to keywords that the dataset does not include. No independent study outside the project team has yet assessed how well the tool works in use. The next step would be to watch researchers outside the team answer questions of their own with it.
Credits
- Skills
- Network visualization
- Interaction design
- Visual prototyping
- Design engineering
- Research tool design
- Tools
- Svelte
- D3
- SVG
- Team
Visualization design and interaction specification
- Zhuoqi Liu
Project coordination
- Todd Linkner
Research leads
- Brian Ball
- Ioannis Votsis
Data preparation and network analysis
- Rafael Morris
- Note
The London team set the research needs. Todd Linkner coordinated between the two groups and worked out with me what was feasible. I defined the features and interactions, wrote part of the code, and debugged and checked the results in reviews with Todd and the London team. Claude Code generated most of the application code.